Be careful what you wish for!
FOMC Conundrum? 
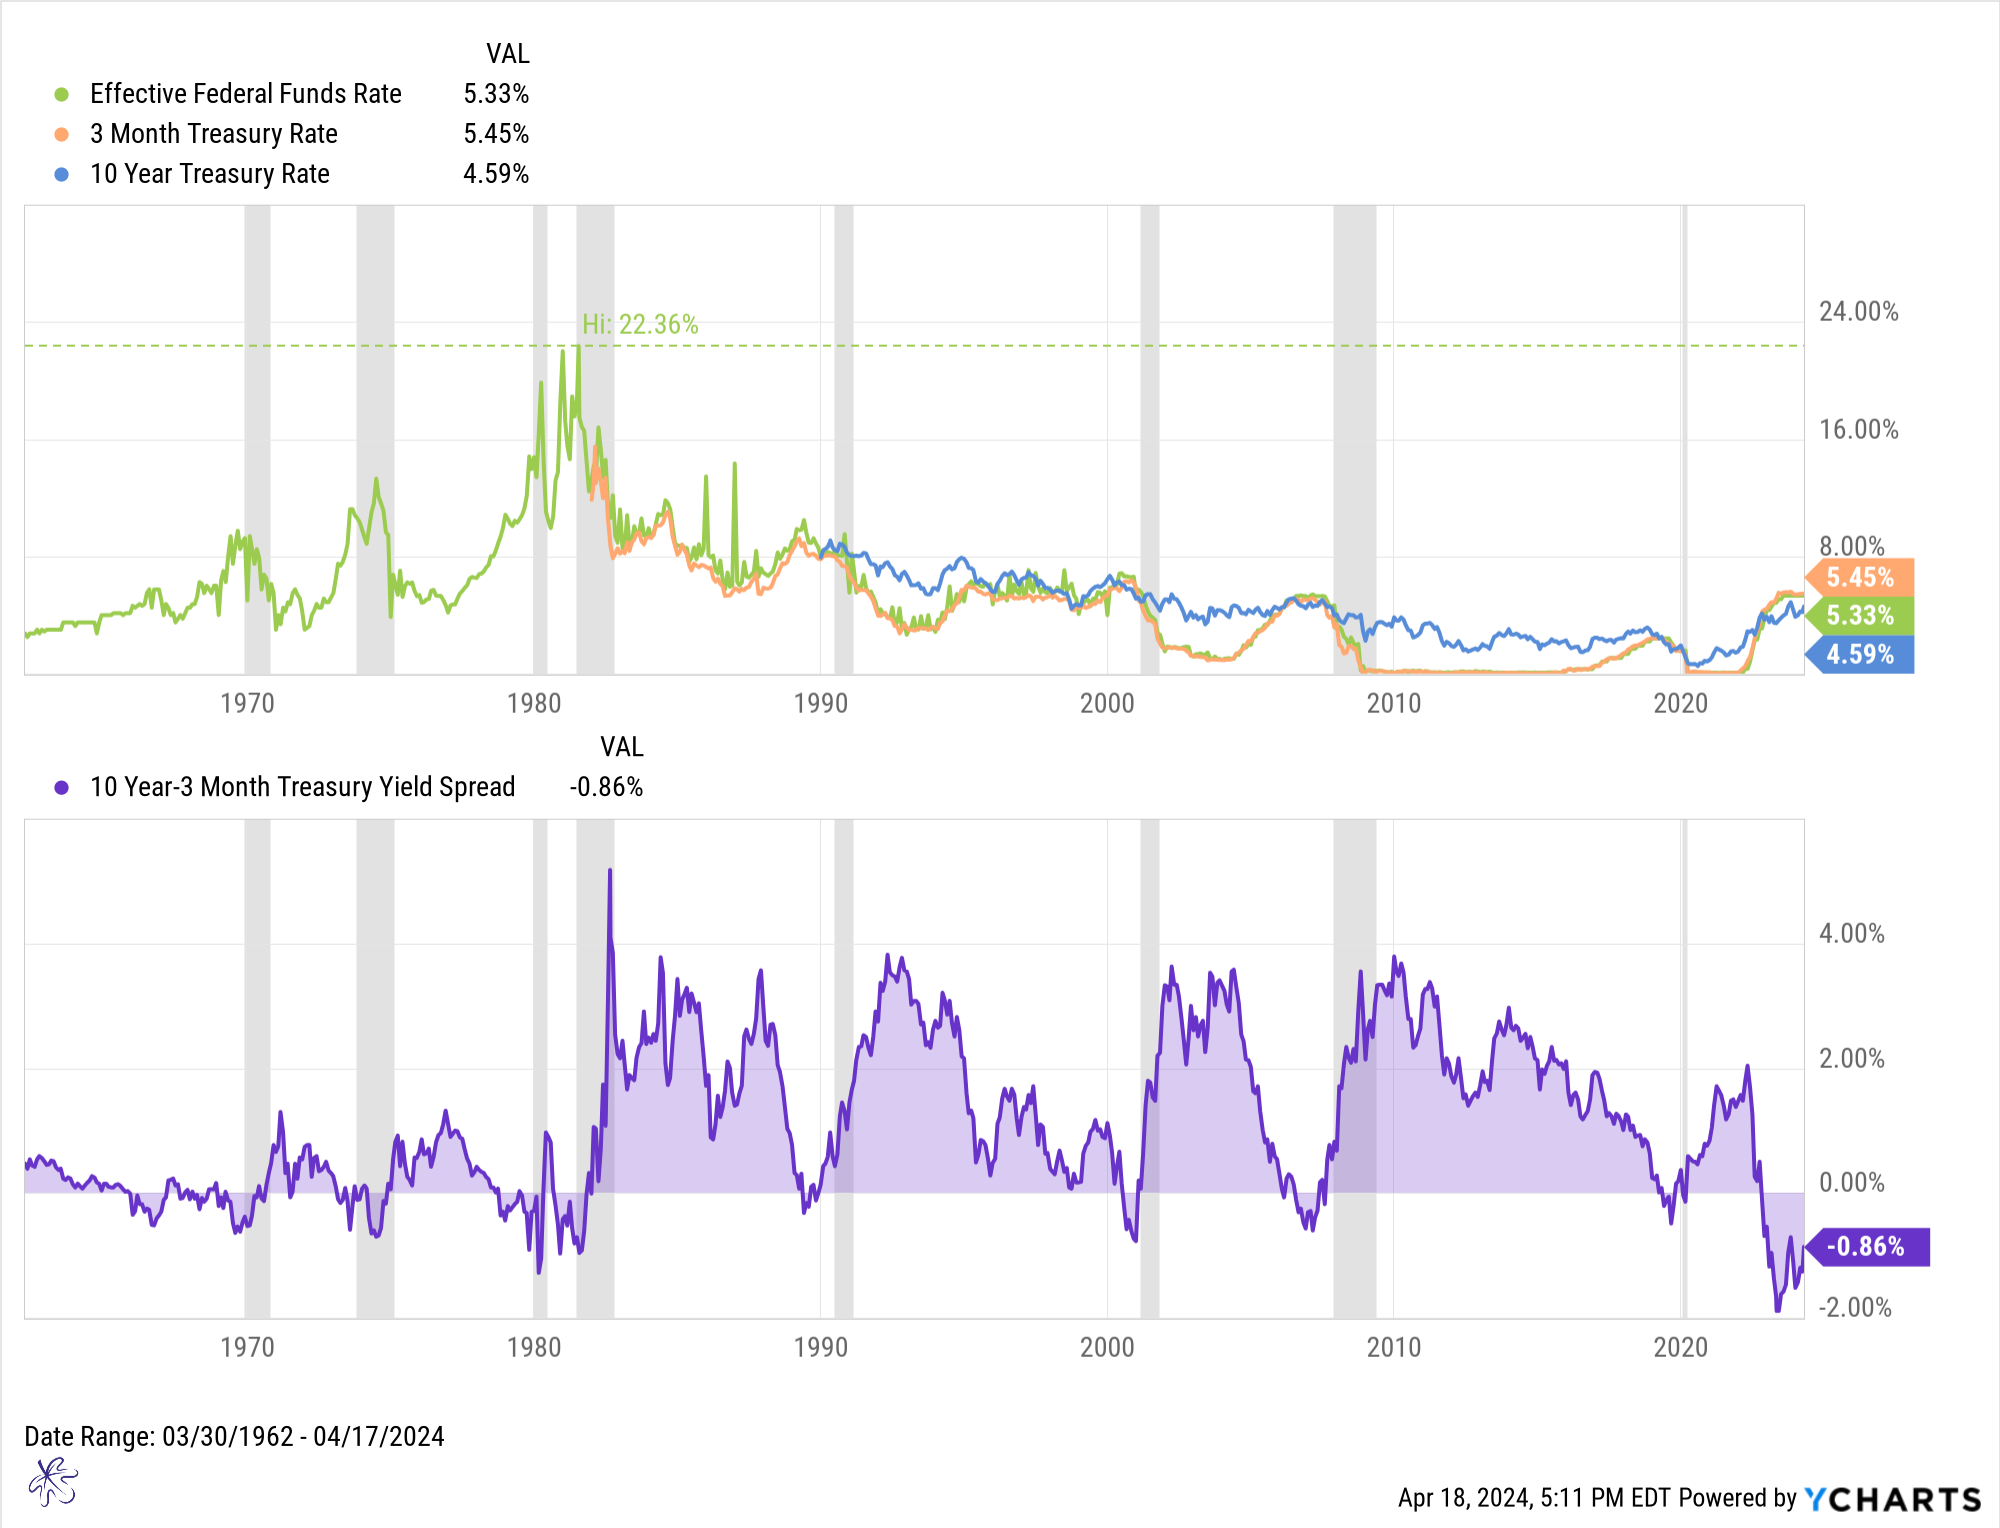
Many investors are looking for the FOMC to cut rates, but do we really want a rate cut? The economy cannot operate in an inverted yield curve environment permanently. The curve needs to normalize. Unfortunately, this cannot happen unless the FOMC brings down short-term rates. Historically the Effective Fed Fund rate has been cut just preceding or coinciding with a recession. Since the 1960’s there has not been one meaningful rate cutting cycle that has not been followed by a recession. Based on history, a Fed rate cut may not be the gift everyone is hoping for.
The line in the sand for the Dow Jones Industrial Average
The Dow Jone industrial average has broken the midpoint of the Bollinger band. It is finding weekly support at the previous resistance levels (yellow line). Intra week, it can be observed that the index tried to rally above the Middle Bollinger Band but failed. A move below this recent support would put the lower Bollinger band in play at 365.73.
Seasonality

Source: Stockcharts.com
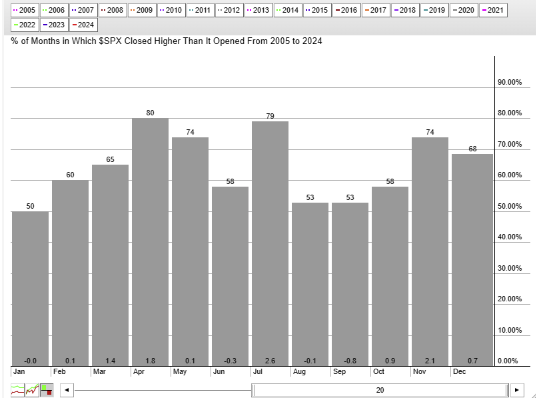
Sell in May and go away is the famous saying. The top chart represents seasonality of the S&P500 index over the past 20 years. The April though July period is one of the most favorable periods for the S&P500. It closes higher, 80%, 74%, 58% and 79% respectively. The next three months are among the worst for the index, from August through October.
Conversely, treasury yields close lower most of the time in July and August. Due to the inverse relation with bond prices, this makes these the two most attractive months to own treasuries based on seasonality.
It may be more appropriate to say, sell in July and buy in November, and don’t forget about those bonds.
