Bearish Signals Emerge: Key Levels to Watch this Week
Failed breakouts, bearish engulfing patterns, and key support levels, the S&P 500 is flashing warning signs. Here’s what to watch next.
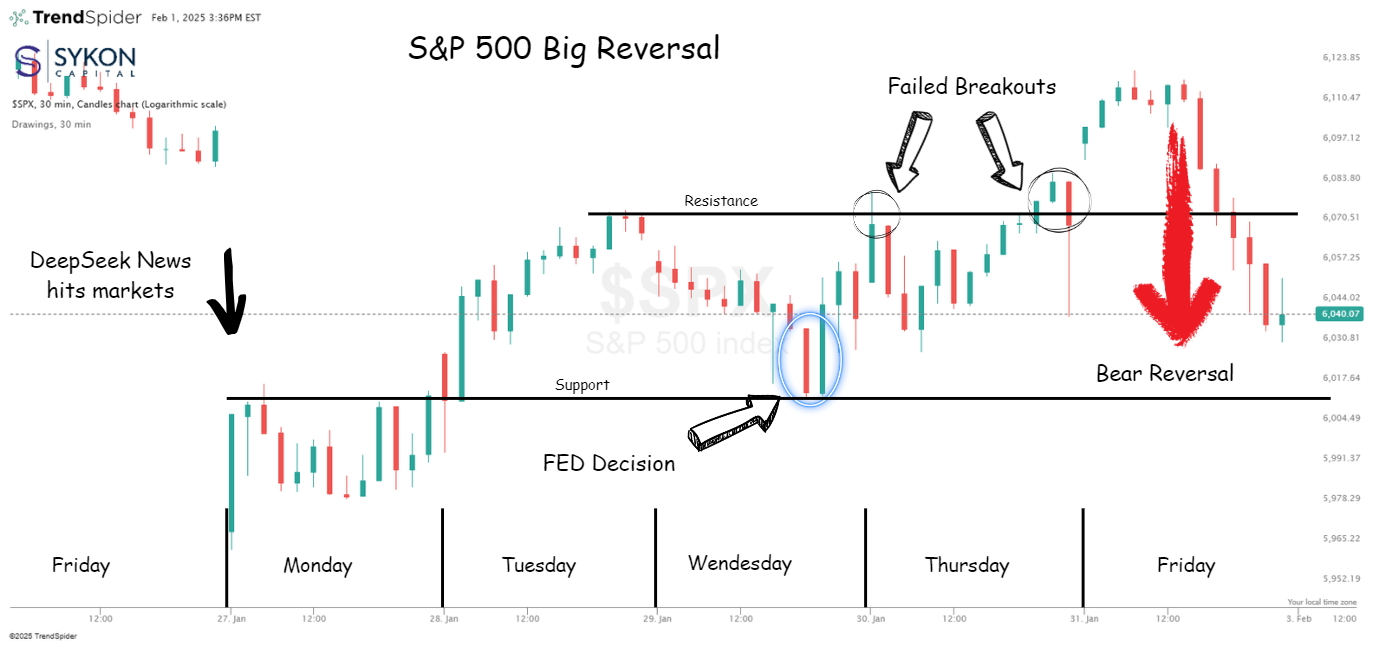
he S&P 500 made a strong attempt to break out of its trading range this week after a major gap down on Monday following the DeepSeek news. However, much like the Dow, the index reversed sharply and dropped back into its prior range.
This failed breakout also meant the S&P 500 couldn’t close the gap from Monday’s open, and instead, it formed a bearish engulfing candle on the daily chart.
This week, all eyes should be on the lower support level. A decisive break below could trigger a deeper pullback, putting further downside in play.
For traders and investors, the takeaway is clear: Know your levels, stay disciplined, and manage risk accordingly.
Momentum is shifting, now it’s about watching where it leads next.
The S&P 500 finished January up 2.78% on a total return basis, and right on cue, the financial media is buzzing about the January Barometer, the idea that the stock market’s performance in January sets the tone for the rest of the year.
It’s a neat story, but is there any real substance behind it?
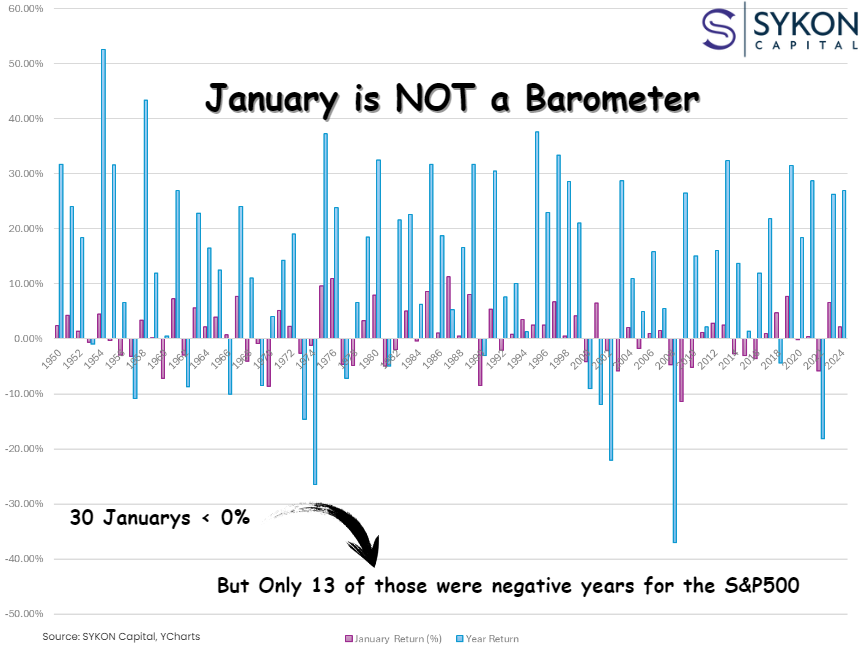
At first glance, the concept seems logical: a strong start signals momentum, while a weak start suggests trouble ahead. But history tells a different story. Since 1950, there have been 30 negative Januarys, yet only 13 of those years ended in the red.
That’s hardly a strong predictive track record.
Some of the market’s best years followed terrible starts. In 2009 the S&P 500 dropped 11.25% in January but ended the year up 26.46%.
Some of the worst years also had strong starts. In 2001 the index gained 6.45% in January, but still finished the year down 11.89%.
In other words, a strong or weak January doesn’t guarantee anything about the months ahead.
Rather than chasing seasonal market myths, investors should focus on data, signals, and fundamentals. Short-term trends can be noisy, and trying to predict the market’s direction based on a single month’s performance is a losing game.
A positive January is great, but it doesn’t tell us anything about how 2025 will unfold. Markets don’t follow simple rules, and neither should your investment strategy. Instead of reacting to headlines, focus on what actually matters - the data.
The past few months have been littered with news, hype, and emotion. My advice? Ignore it.
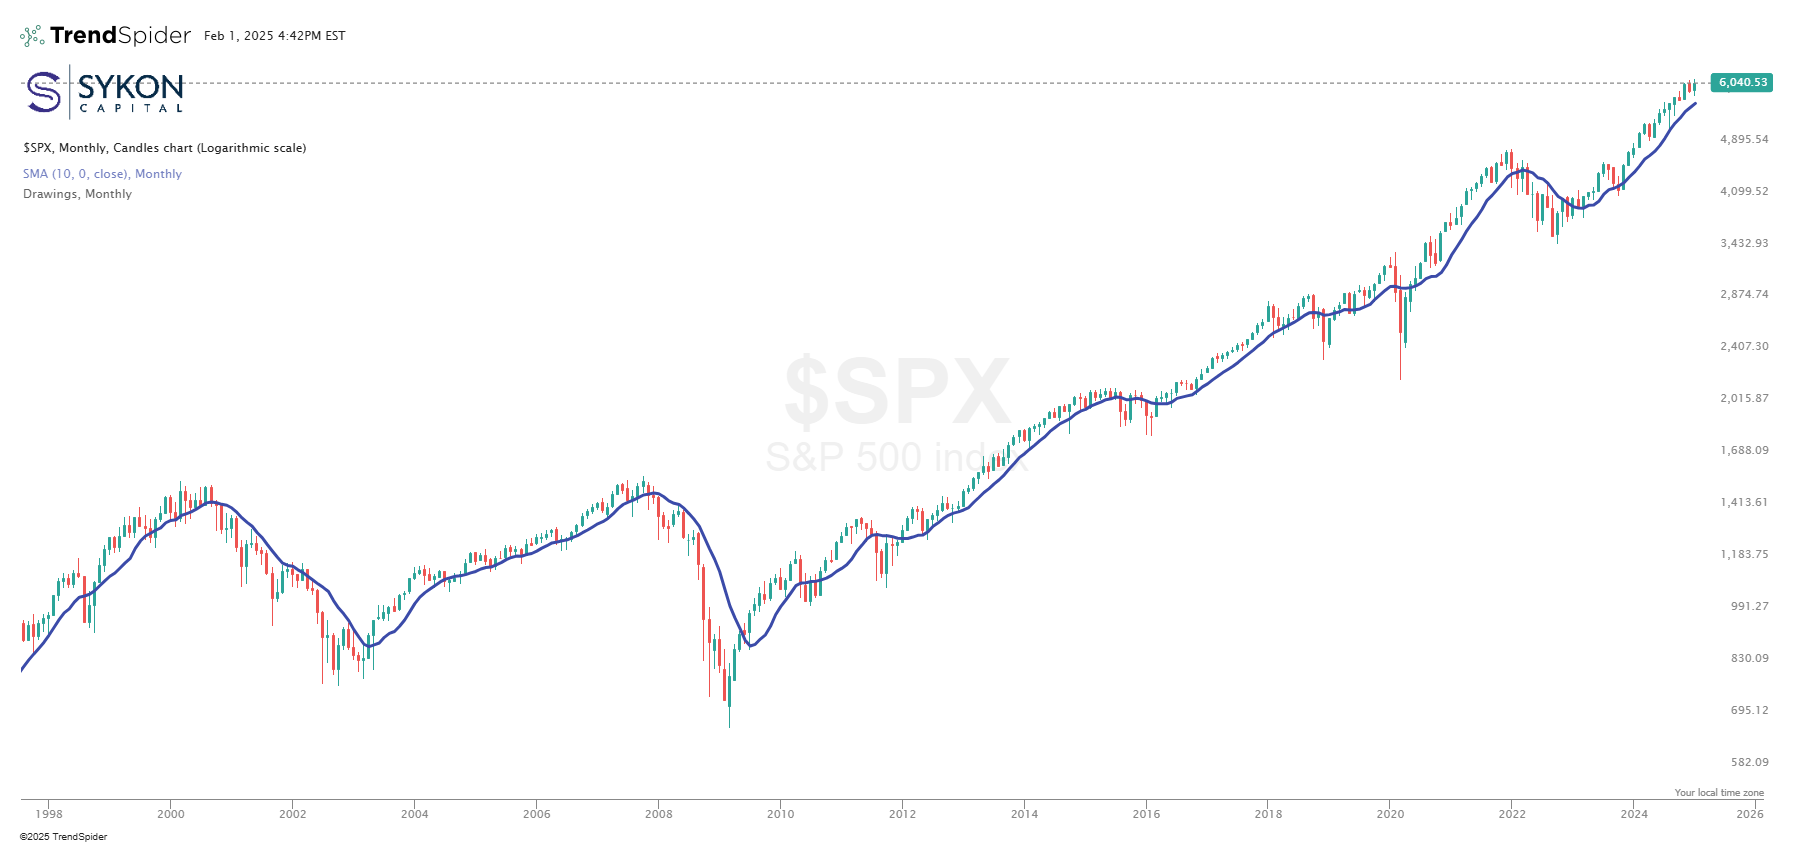
Pick an indicator. Pick a level. In this case, the 10-month moving average of the S&P 500.
• If the index stays above this level, it’s an uptrend. Staying long probably makes sense.
• A move below likely signals a trend change, meaning the odds are no longer in your favor.
Let prices lead. The fundamentals will follow.
