Can AI Continue Driving the Semiconductor Boom? A Look at Historical Patterns
As investors chase the potential of Artificial Intelligence (AI) to positively impact companies, it has driven the Philadelphia Semiconductor Index to levels relative to the S&P 500 that we haven't seen in nearly 25 years.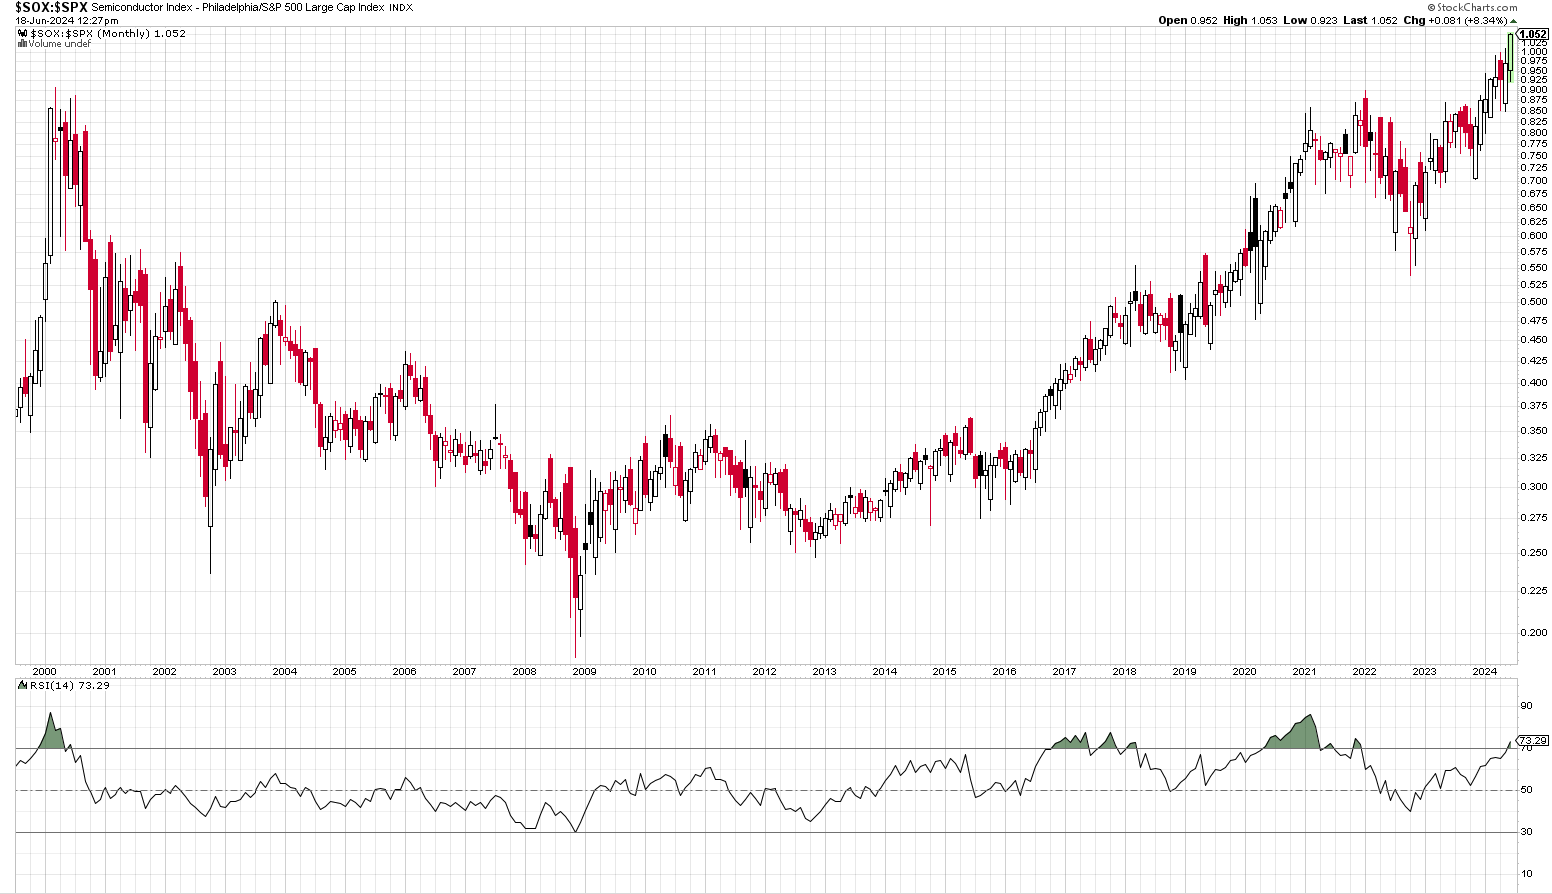
Key Insights:
· Semiconductor Sector Surge: The semiconductor sector has been one of the biggest beneficiaries of the AI craze in recent years. Consequently, the prices of index constituents have surged, particularly in comparison to the broader S&P 500 index.
· Ratio Chart Analysis: The ratio chart above illustrates the relationship between the semiconductor index and the S&P 500. A rising chart indicates that semiconductors are outperforming the S&P 500, while a declining chart indicates the opposite.
· RSI Indicator: The bottom of this chart uses the RSI (Relative Strength Index) indicator to identify overbought conditions. When the RSI is above 70 (green shaded area), the ratio chart is overbought. Over the last 25 years, there have been three major clusters of overbought conditions: in early 2000, during 2017 and 2018, and leading up to 2022.
Current Market Conditions
Today, we are once again approaching these RSI overbought levels. While this is not a definitive prediction, it's worth considering that historically, these conditions have often led to changes in relative market leadership. For example, the leadership change in early 2000 extended over a 10-year period.
What Does This Mean for Investors?
Given this context, there's a real possibility of a shift in market leadership, even with the most optimistic outlooks. Maintaining a diversified portfolio can help mitigate some of the risks if a leadership change does occur.
Conclusion and Next Steps:
While the semiconductor sector continues to benefit from AI advancements, it's crucial for investors to remain vigilant and consider historical patterns. Diversification remains a key strategy in managing potential risks and capitalizing on new market opportunities.
