Changing tides in the markets
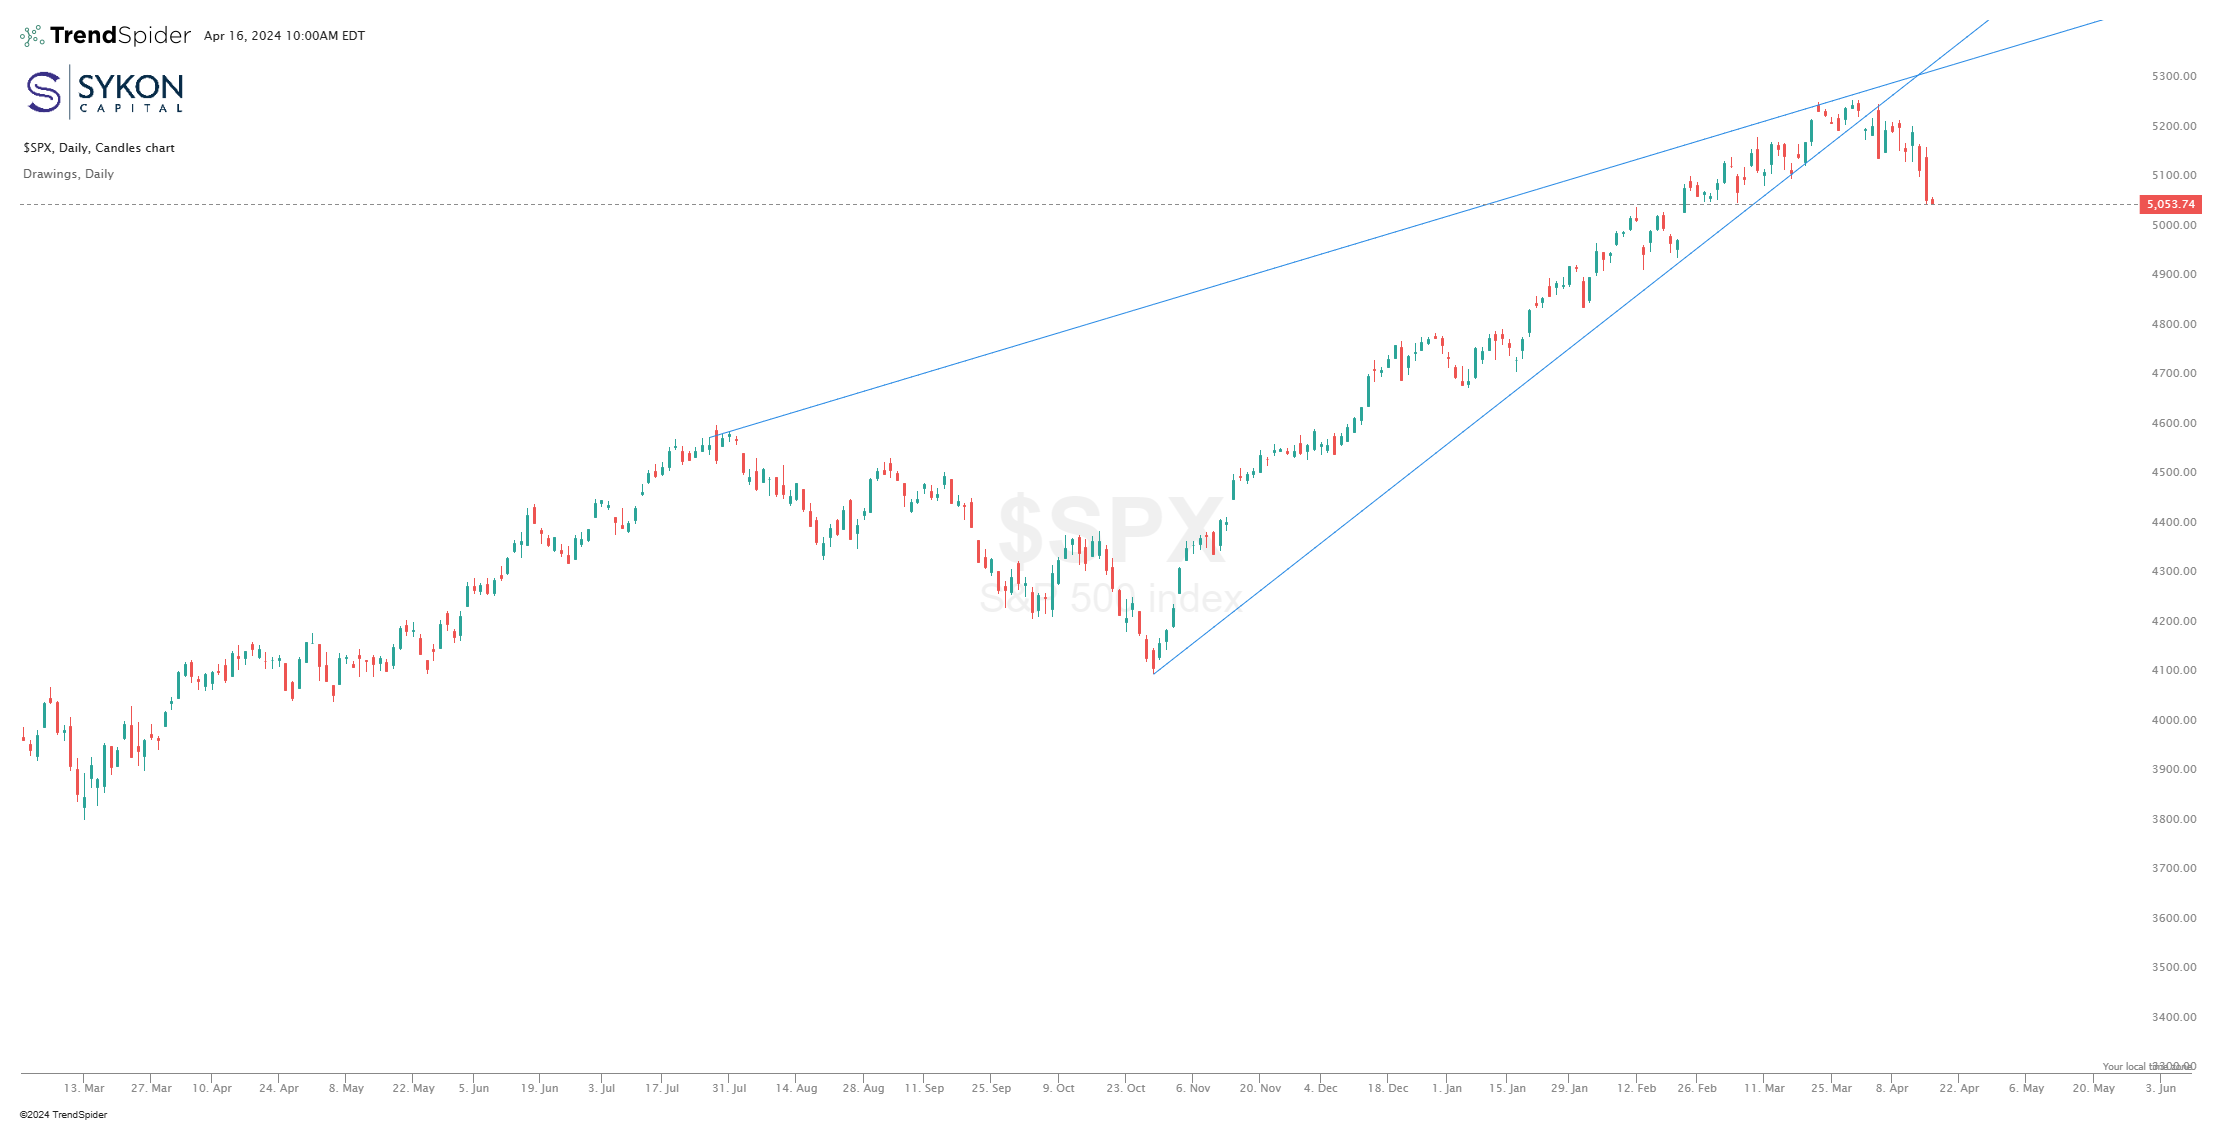
Rising Wedge Broken
The S&P500 index has been forming a rising wedge pattern based off the July 2023 peak and October 2023 low. A rising wedge is traditionally a bearish reversal pattern and the SP&500 index has broken this pattern to the downside. The first support level comes into play at the February gap of 5032. The next support level is at the January gap and retest of 4954.
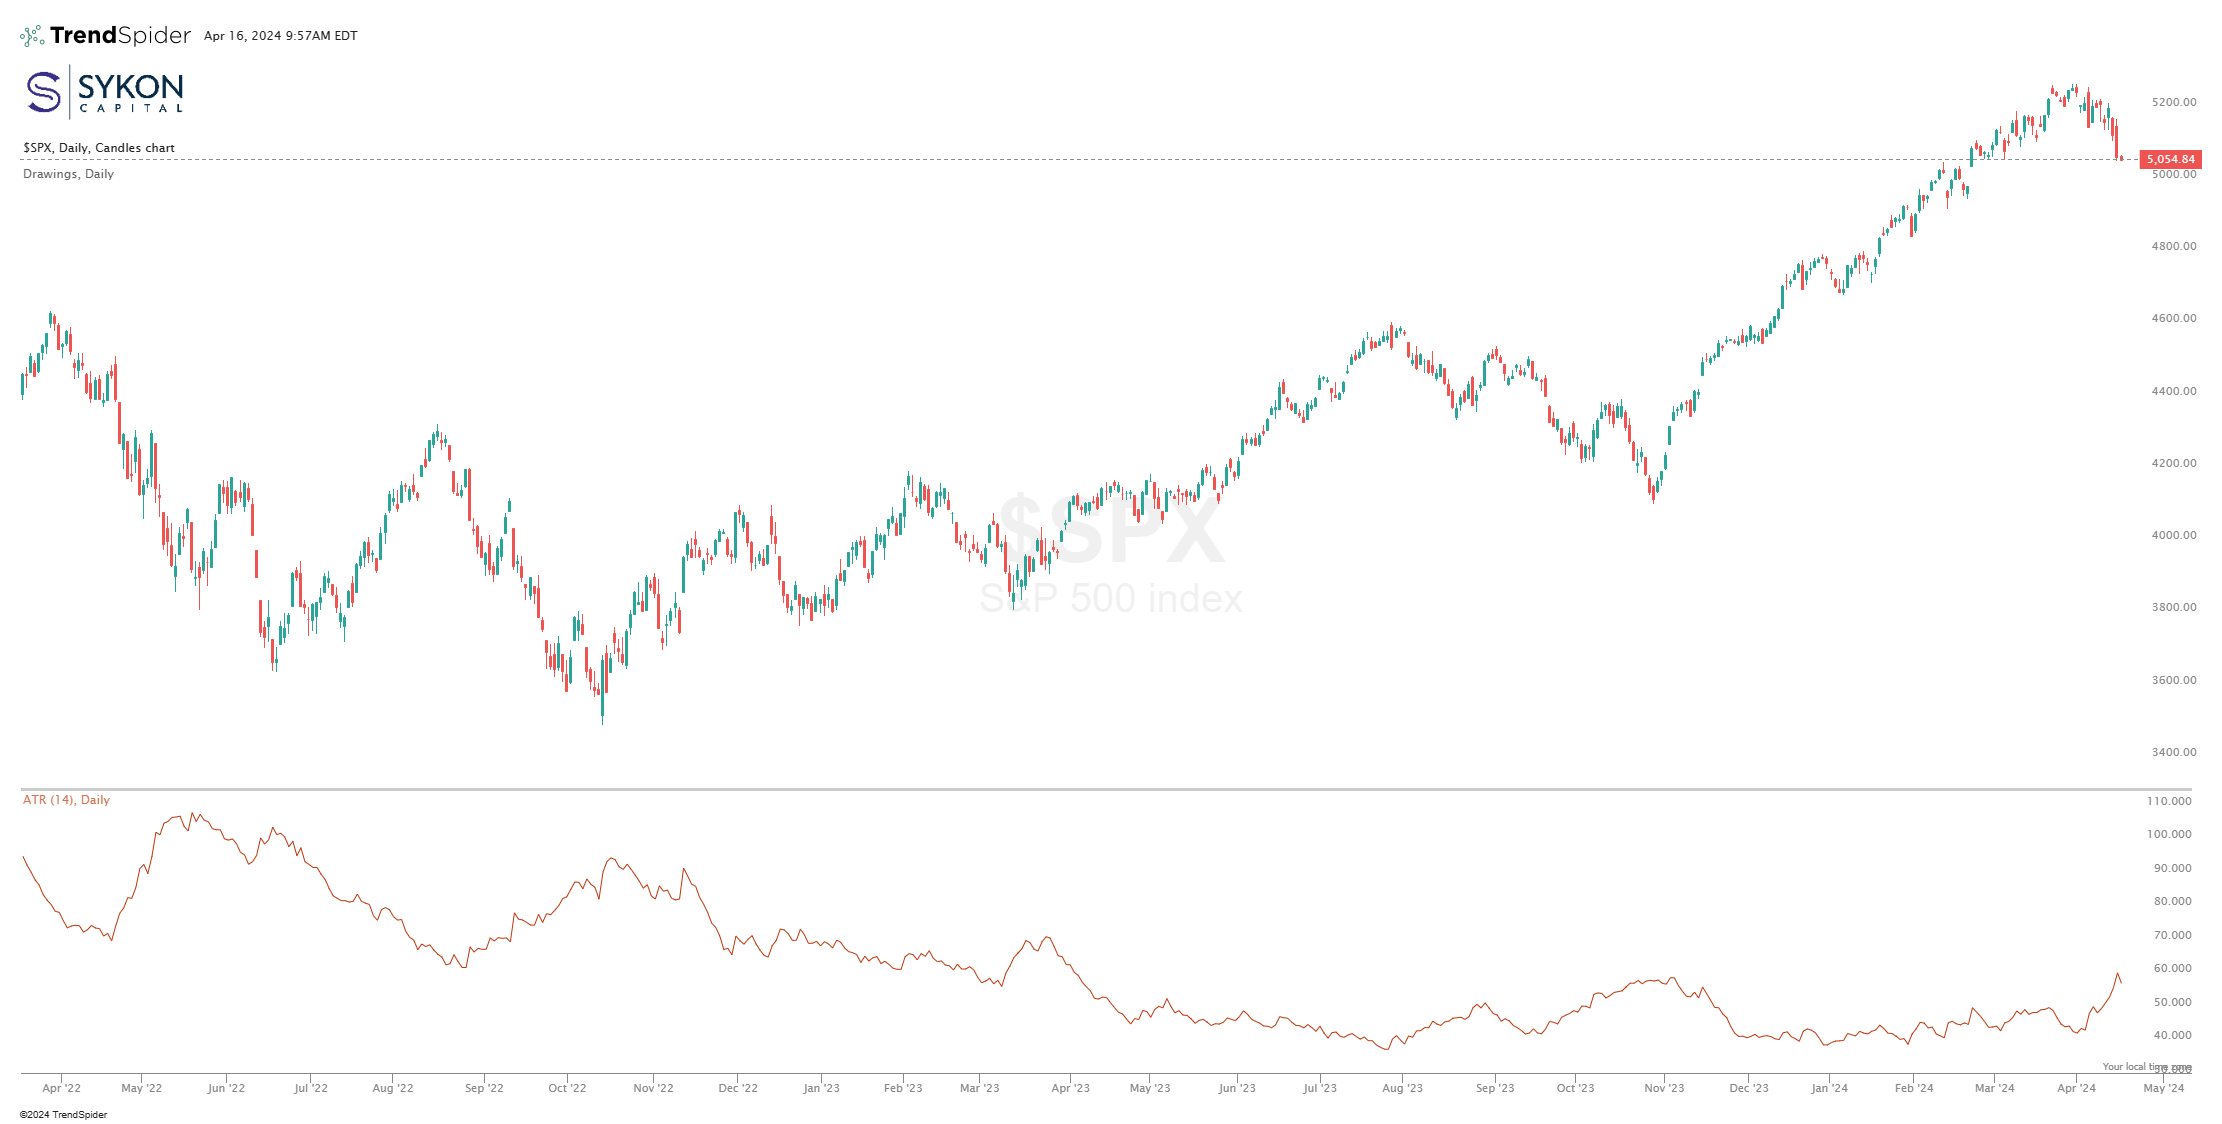
Multiple Time Frames

These two charts look at the 14 period Average True Range of the S&P500 index. The top chart provides a daily view, while the bottom chart is the weekly view. After a period of a very contracted Average True Range, it has recently widened very quickly on the daily charts. The weekly charts still indicate that the overall Average True Range is contracted. Generally, the daily will lead the weekly indicator, increasing the probability that the weekly Average True Range may expand as the result of increased pressure to the downside on the weekly chart. This raises the potential for significant downside risk in the S&P500 index.U.S.
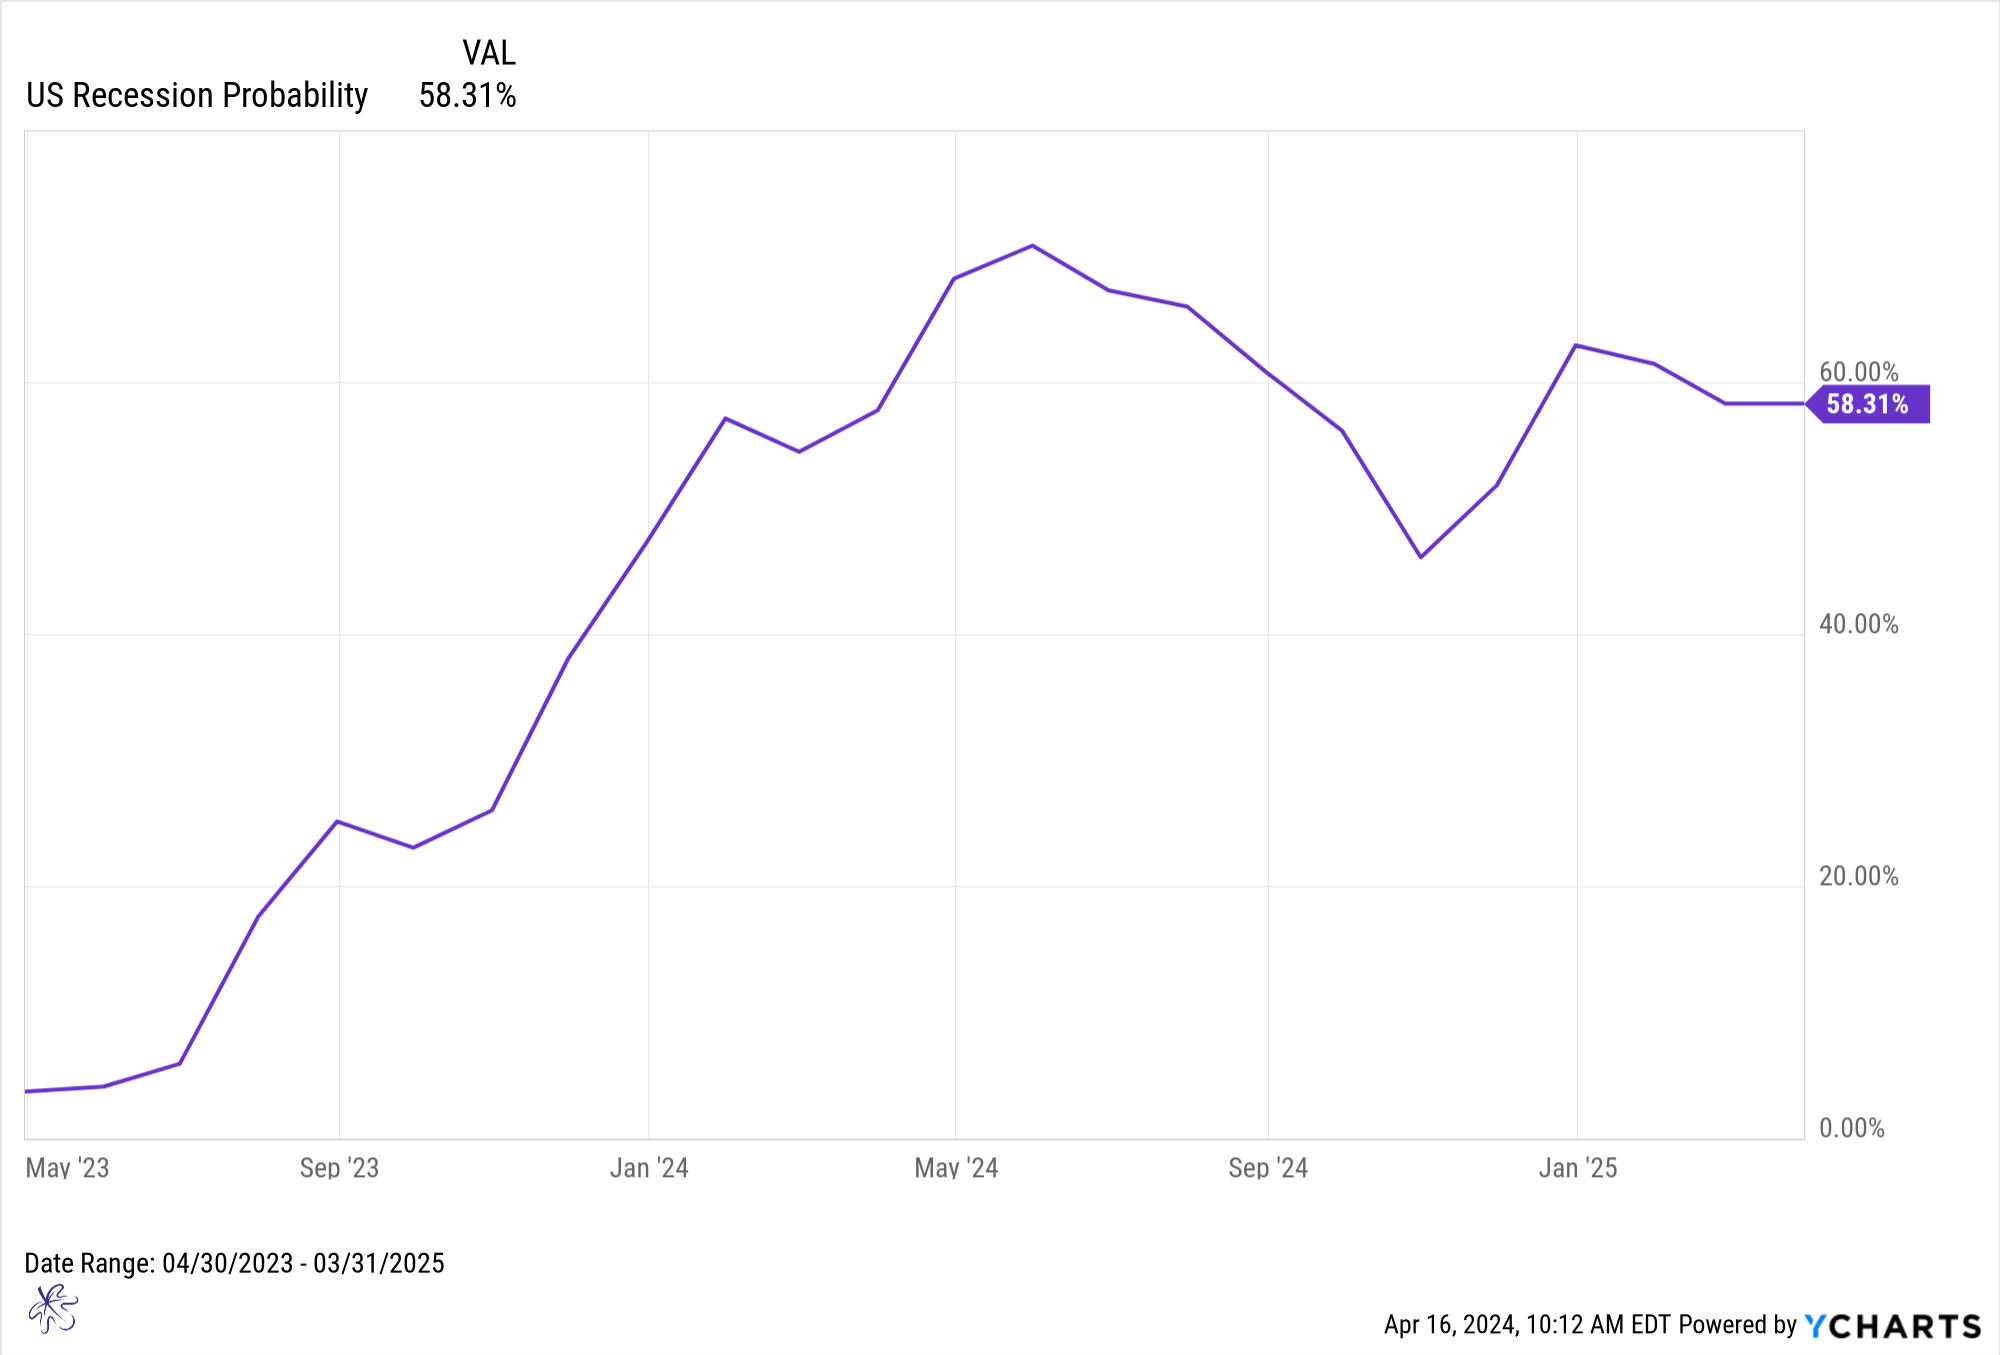
U.S. Recession Probabilities Peaking
Twelve-month forward-looking recession probabilities are spiking to 58.31% looking forward to March of 2025. But the recession probabilities peak next month in May of 2024 at 70.85%. Remember this data is based on the 10-year minus 3-month treasury yield curve from 12 months ago. This spike is also coinciding with the newly reemerging market volatility. Just one more reason to be cautious.
