Dow Theory has long been an important indicator of market strength. What is this important indicator telling us today?
The relationship between the Dow Jones Industrial Average and the Dow Jones Transportation Index has long been an important indicator to watch for confirmation of market strength. But what happens when these two averages diverge?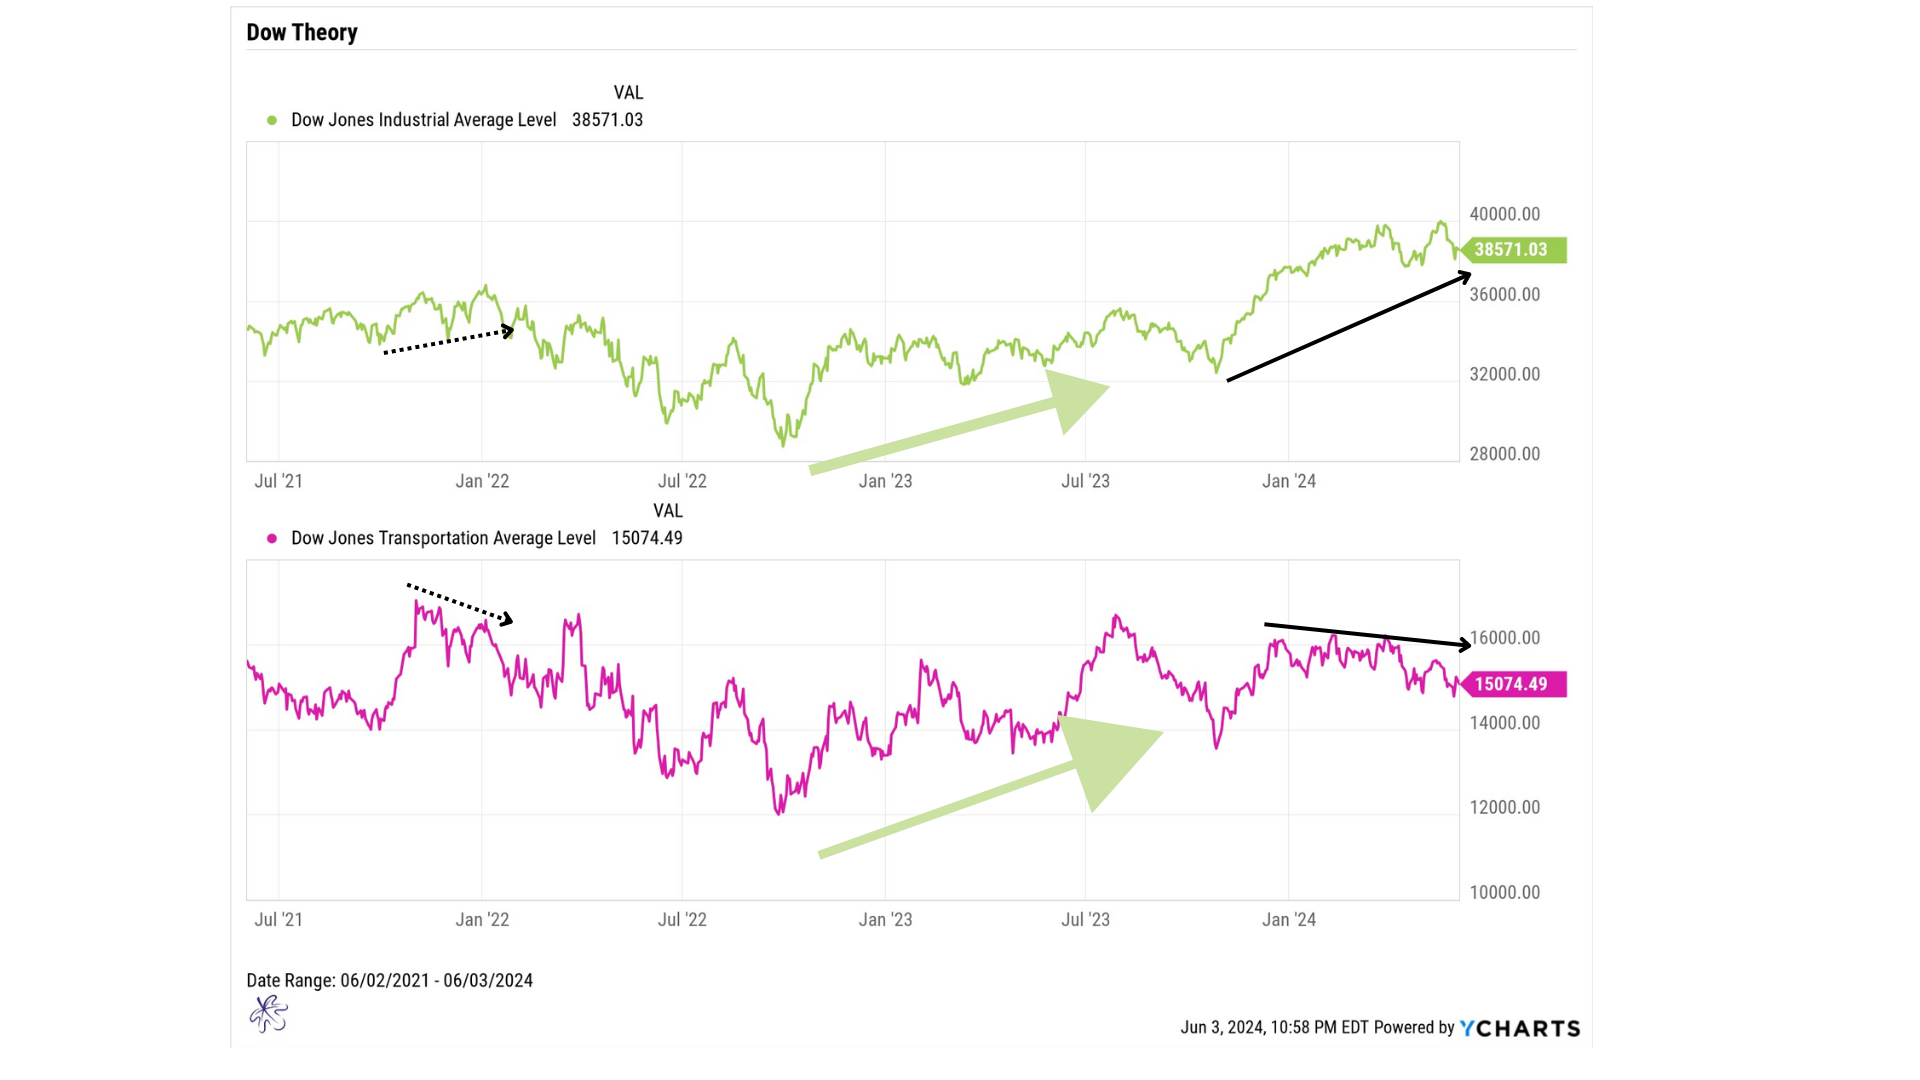
While there are a few key components to the formal Dow theory, one of the more widely accepted rules is that the Dow Jones Industrial average and Transportation average should be moving in the same direction to confirm the trend. When these components are moving in opposite directions, this is known as a divergence.
The big green arrow on the chart above highlights how the DJ industrial average and transportation average were confirming the uptrends from late 2022 through summer of 2023. This is a confirming uptrend. Most recently the DJ industrial average has been pushing to new highs while the DJ transportation average is making lower highs and lower lows. This is indicated by the solid black lines on the right side of each chart.
Last time this happened was early 2022. The is indicated by the doted black line on the let side of the chart. In late 2021, the transportation average started making lower highs while the industrial average made higher highs. Ultimately that divergence led to a significant selloff throughout 2022.
While history does not always repeat, it does often rhyme. This is just one more reason to be diligent and be sure your asset allocation is properly aligned by rebalancing your portfolio. This can be particularly important now because there are so many assets that have run up substantially over the past 2 years while others may be flat or even negative. This extreme imbalance in asset performance may have tilted a portfolio that should by 60% stocks and 40% bonds to one that is 70% stocks and 30% bonds. This could potentially be creating unintended portfolio risk from the extra exposure to stocks relative to you baseline allocation.
Regular rebalancing may create a systematic approach to taking profits in profitable positions, while reallocating assets to positions that are underweight.
Systematic rebalancing can be a very effective and simple risk management tool.
