Ignoring the Bubble Could Be a Costly Mistake for Investors
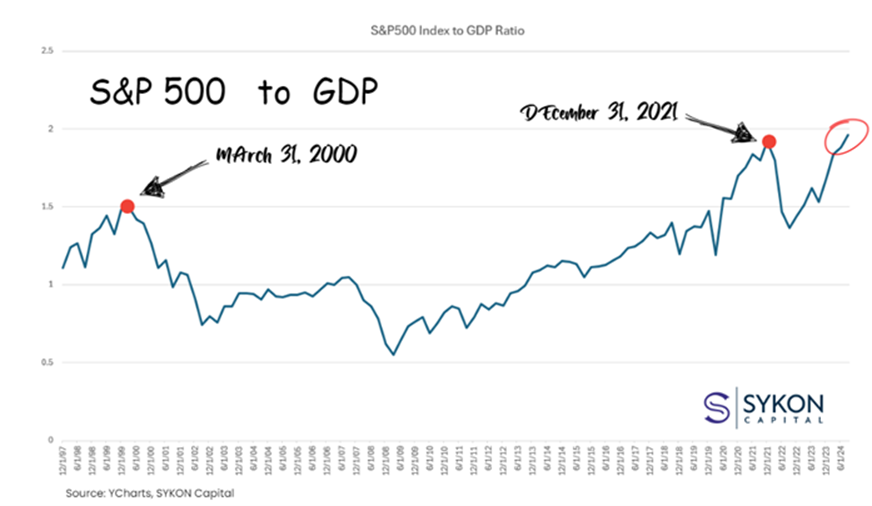
The stock market is riding high, but is it riding too high? The ratio of the S&P 500 Index to GDP has reached its highest level in 25 years, flashing a warning sign that many investors are ignoring. Historically, whenever this ratio hit extreme levels, it was followed by a painful market correction.
Despite today’s optimism, the data tells a familiar story: we believe we are in a bubble.
Bubbles aren’t new, and they’re never obvious in the moment. But with valuations soaring to levels seen before the Great Depression and the Dot-Com Bubble burst, it’s time to ask hard questions. Are we making the same mistakes as investors of the past?
If we’re not careful, we might learn the answers the hard way.
The Markers of a Bubble
What exactly defines a stock market bubble? Bubbles occur when the prices of financial assets, such as stocks, rise significantly above their intrinsic value, driven by a dangerous mix of speculation, exuberance, and herd mentality.
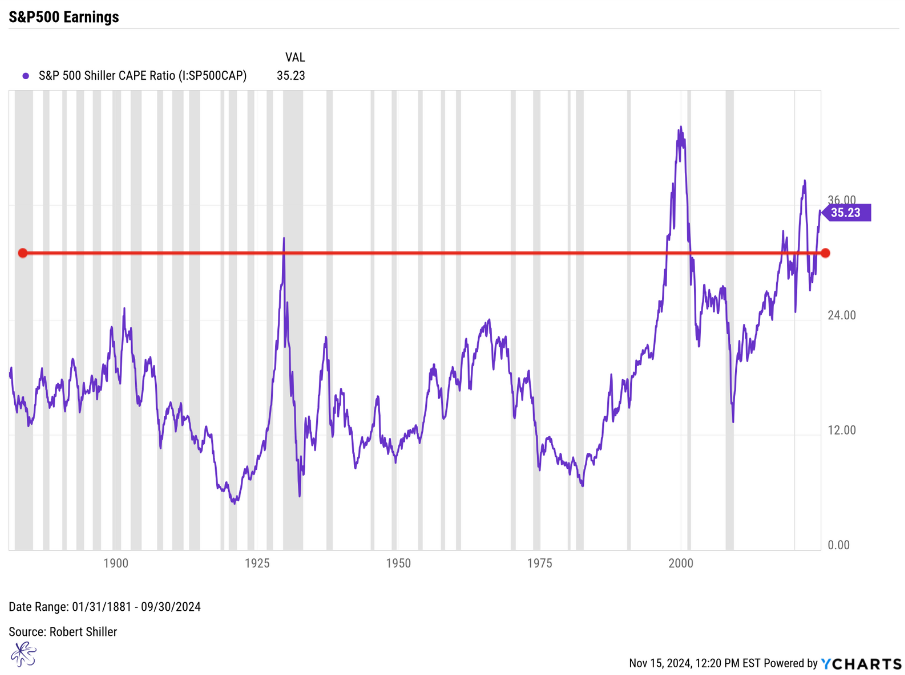
*Grey areas indicate a recession
By historical measures, the S&P 500 Shiller CAPE Ratio is flashing red. It’s currently at levels consistent with some of the most infamous bubbles in market history, including:
· The Great Depression of 1929,
· The Dot-Com Bubble burst of the early 2000s,
· And the 2022 market sell-off.
Echoes of the Past
Today’s environment has a striking resemblance to two defining bubbles in history:
The Roaring ‘20s
The 1920s were characterized by easy credit and the rise of margin trading, where investors borrowed heavily to buy stocks. This artificially inflated prices and created a fragile system vulnerable to collapse. At the same time, rapid growth and technological innovation, particularly in the booming automotive industry, fed the belief that the market’s upward trajectory was unstoppable.
Does this sound familiar? In many ways, the dynamic of easy money and technological optimism mirrors the current environment.
The Dot-Com Bubble
The late 1990s saw the internet hailed as a revolutionary force, fundamentally transforming how businesses operate and people interact. Investors bid up valuations on the belief that this “new economy” rendered traditional metrics like earnings irrelevant. Many companies went public with little more than a domain name and a dream, leading to astronomical valuations.
The story today isn’t too different. If you substituted “AI” for “internet,” you’d find a narrative eerily similar to the dot-com era. And just like then, many investors today believe that this time is different.
Today’s Warning Signs
Several key indicators suggest we are living through yet another bubble:
Equity Risk Premium Collapse
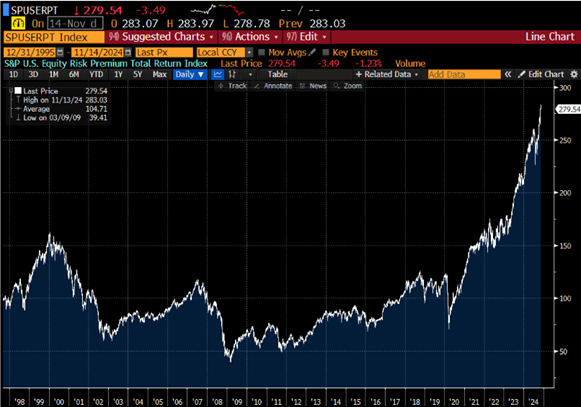
Source: Bloomberg, This Index measures the spread of U.S. stocks over the returns of long-term Government Bonds. The constituents include the S&P 500 Futures Excess Return Index and the S&P 30 Year U.S. Treasury Bond Futures Excess Return Index.
The spread between U.S. stock returns and long-term government bonds (the equity risk premium) has collapsed. Equities are now more expensive relative to bonds than they’ve been in the past 25 years.
Historically, peaks in this index have coincided with major market events like the Dot-Com Bubble burst, the Financial Crisis, and the Pandemic-driven sell-off.
Overvaluation
Stock prices are disconnected from fundamentals. The ratio of the S&P500 index to GDP is at levels seen just before the dot com bubble burst and the 2022 market sell off
Learning From History
Despite the parallels, many investors insist, “This time is different.”
But is it?
History tells us that every bubble comes with its own narrative that justifies extreme valuations, until it doesn’t.
Take a moment to reflect on past bubbles. Investors in the 1920s believed the automobile boom would sustain infinite growth. In the 1990s, they thought the internet had rewritten the rules of valuation. Both were correct about the transformative power of these technologies, but their timing was wrong, and the market punished them for it.
Why This Matters Now
As the visuals included here show, today’s market valuations are well into bubble territory. Equity prices are stretched, and speculation has driven them far beyond what current fundamentals support. Investors face a decision:
Will you learn from the past, or will you repeat it?
Check Your Biases at the Door
Key characteristics of a stock market bubble include:
- Overvaluation: Stock prices exceed companies’ intrinsic value.
- Rapid Price Increase: Prices rise sharply, driven by speculation.
- Speculation: Investors ignore risks.
- Detachment from Fundamentals: Prices become disconnected from economic reality.
If these traits sound familiar, it’s because we’ve seen them before. The good news is that history provides a clear warning.
The bad news? Ignoring it can be costly.
So before chasing the latest trend or justifying sky-high valuations with “this time is different,” pause. Take a step back. Sometimes, the best investment decision is the one that protects you from yourself.
