No, it is NOT different this time
“This time is different.”
It’s a phrase I’m seeing everywhere; on social media, in research reports, and even in casual conversations among investors. But here’s the thing: I believe these four words are some of the most dangerous in investing. Why? Because history has a way of rhyming, and so far, the data doesn’t support a different outcome.
Let me show you why this time is not different:
- The yield curve is behaving exactly as it did before each of the last eight recessions.
- The expected pace of rate cuts is following the same pattern we've seen before downturns.
- The new construction market is mirroring the trends that typically signal a looming recession.
- And yes, the current strength of the employment market in my opinion, is not as reassuring as it seems.
The signs are there, just like they’ve always been. And while I’m hoping the optimists are right, I’m reminded of how often these same indicators have told a story that doesn’t end well.
The Yield Curve
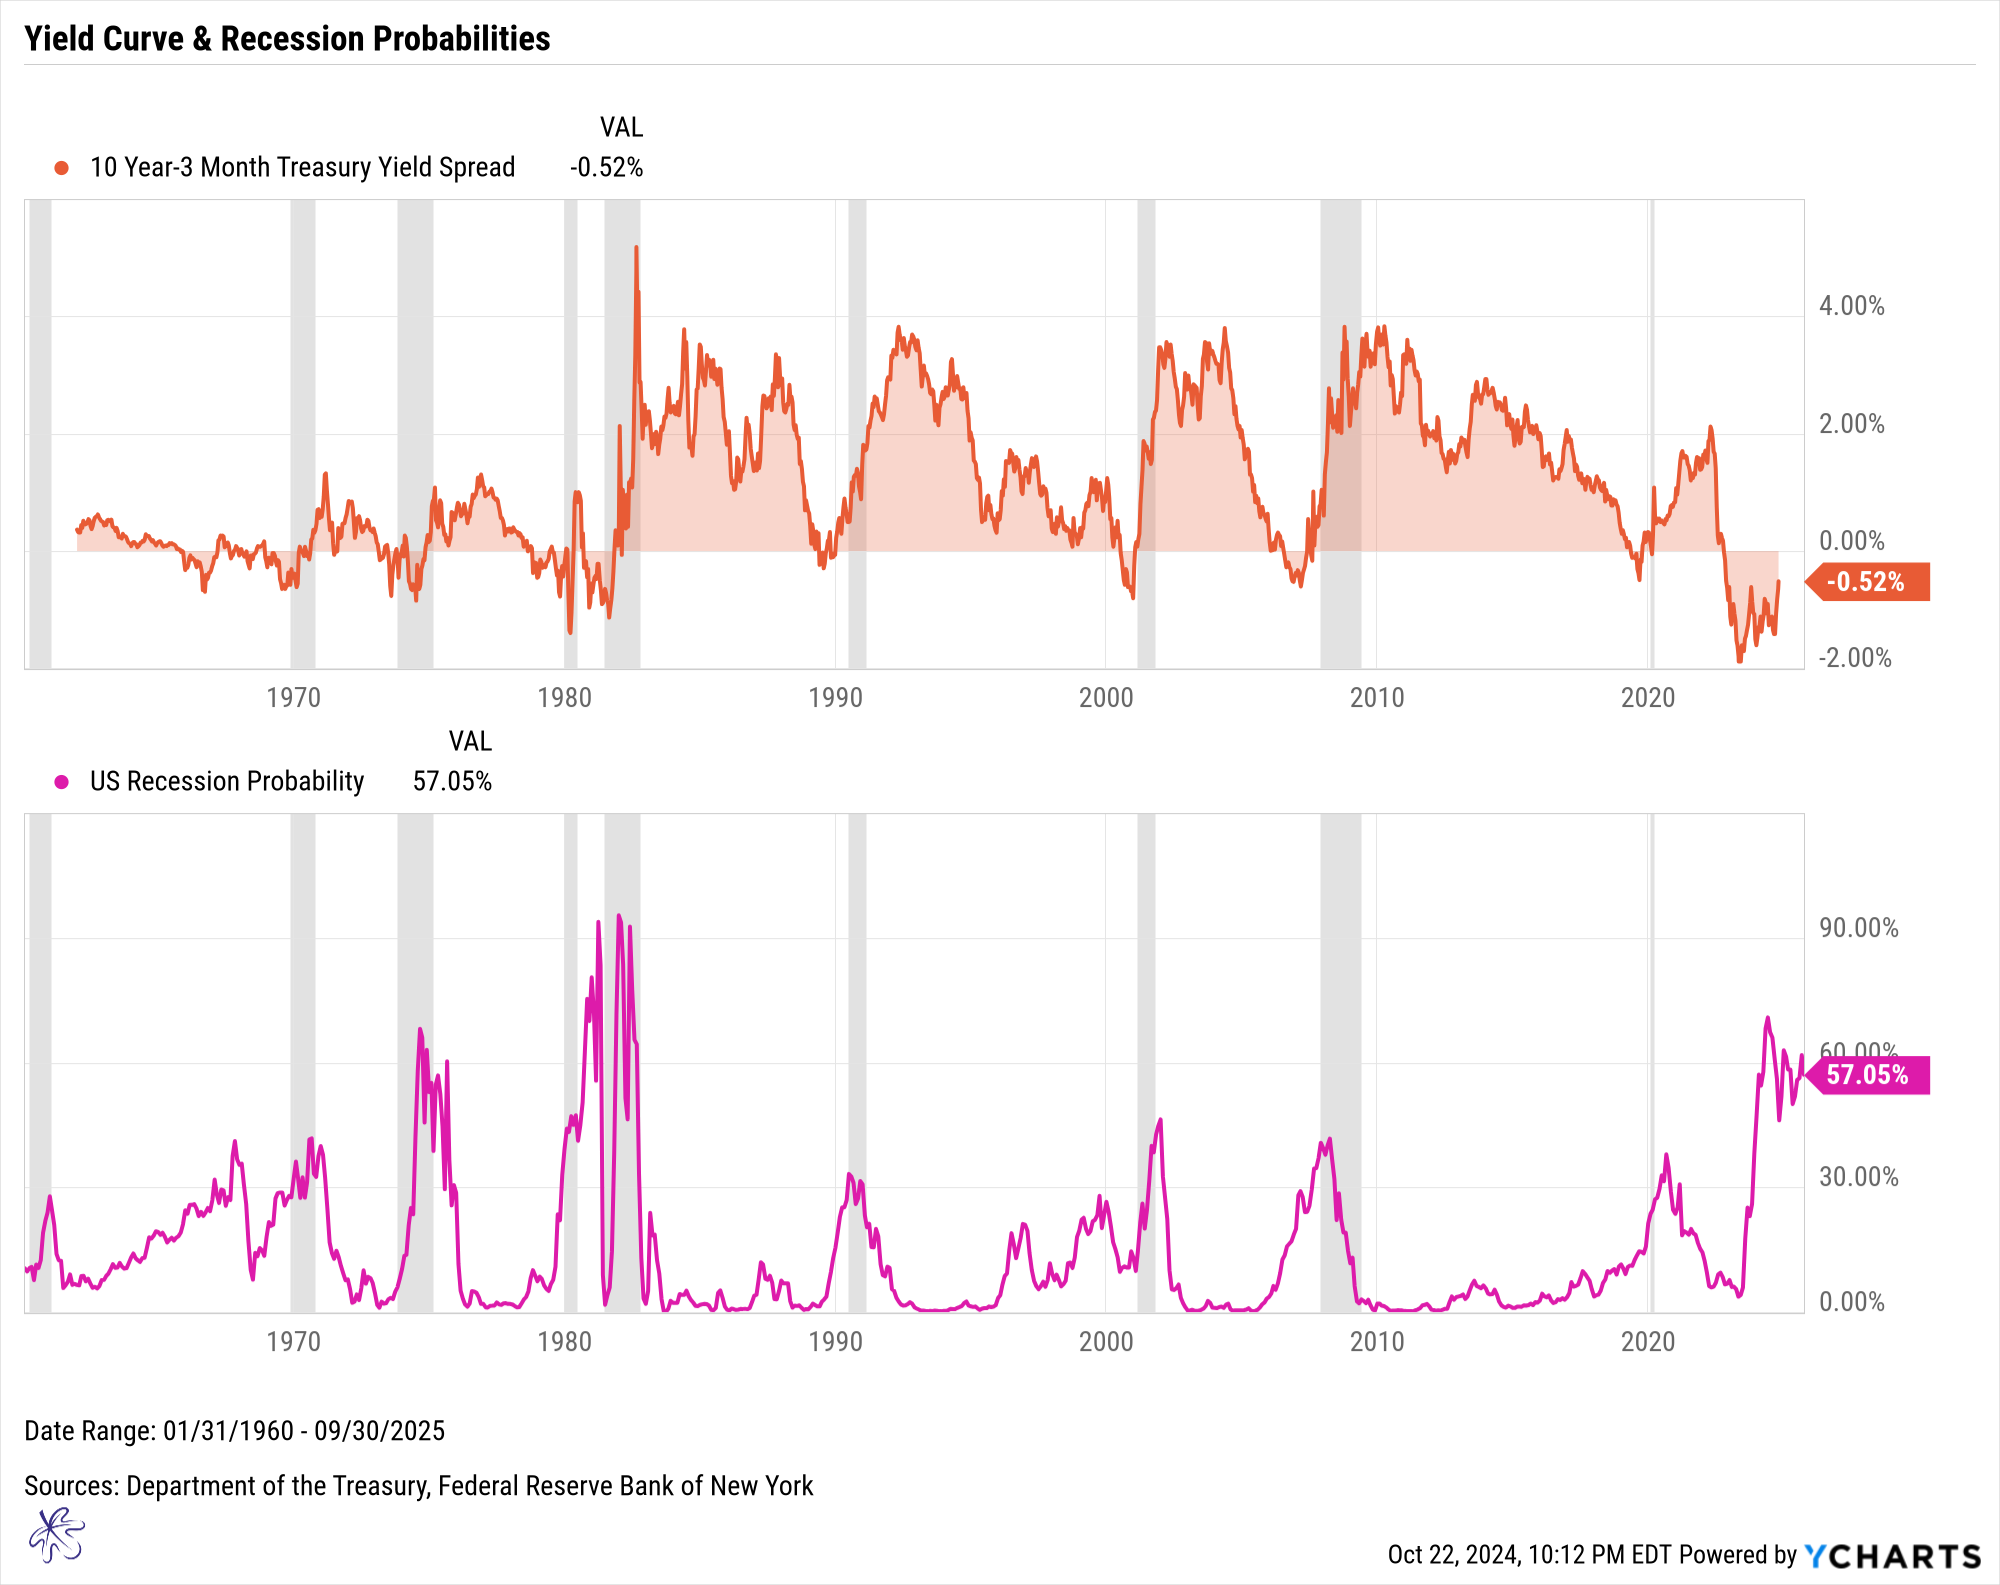
Historically, the market often continues to rise even while the yield curve is inverted, as it is now. But when this curve reverts, that’s the warning bell we can’t ignore. The orange graph above depicts how the 10-year minus 3-month yield curve has reverted prior to each of the last eight recessions over the past 50 years.
Key Takeaway: The yield curve’s inversion has been one of the most reliable leading recession indicators for over 50 years.
For this scenario to be different this time, we would need to see this yield curve revert and steepen without a recession occurring within the next nine months.
Betting that this time is different? That’s not strategy, that’s hope.
Expected Pace of the Rate Cuts
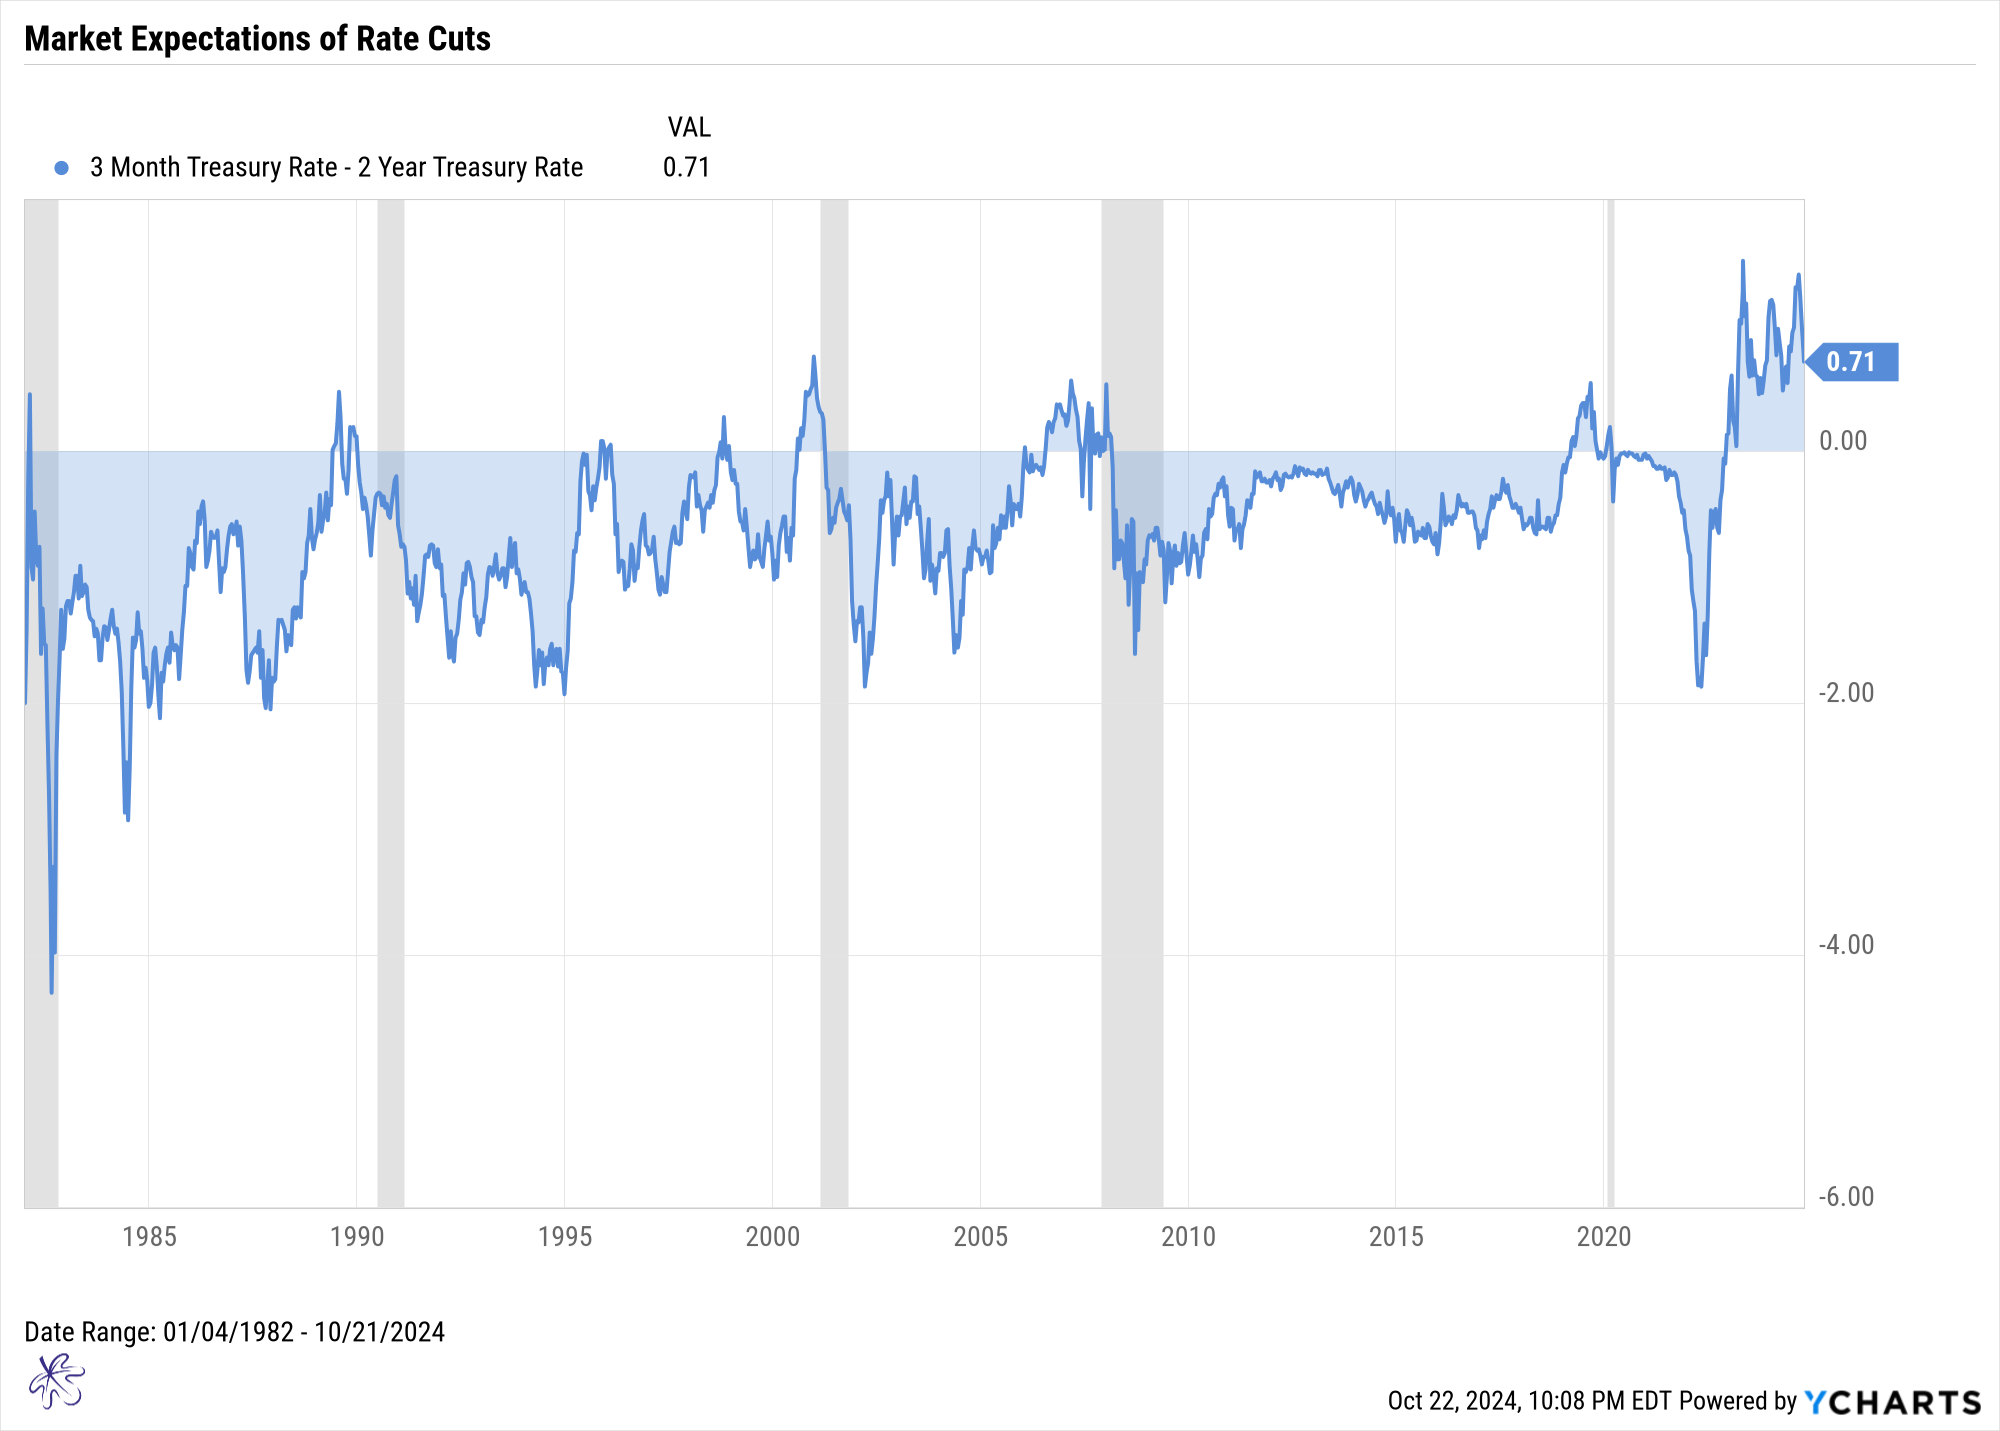
A positive spread between the 3-month and 2-year Treasury rates signals that the market is expecting rate cuts. When the 2-year Treasury rate trades below the 3-month rate, it's an indicator of future rate declines. The wider the spread, the faster the market anticipates rate declines. Historically, this anticipation has preceded each of the last five recessions.
Key Takeaway: Rate cut expectations aren’t just guesses, they reflect real economic concerns, typically preceding downturns.
For this scenario to be different from the past, the spread would need to narrow, with rates moving back to a negative spread without triggering a recession. And again, I’m not holding my breath.
New Construction Market
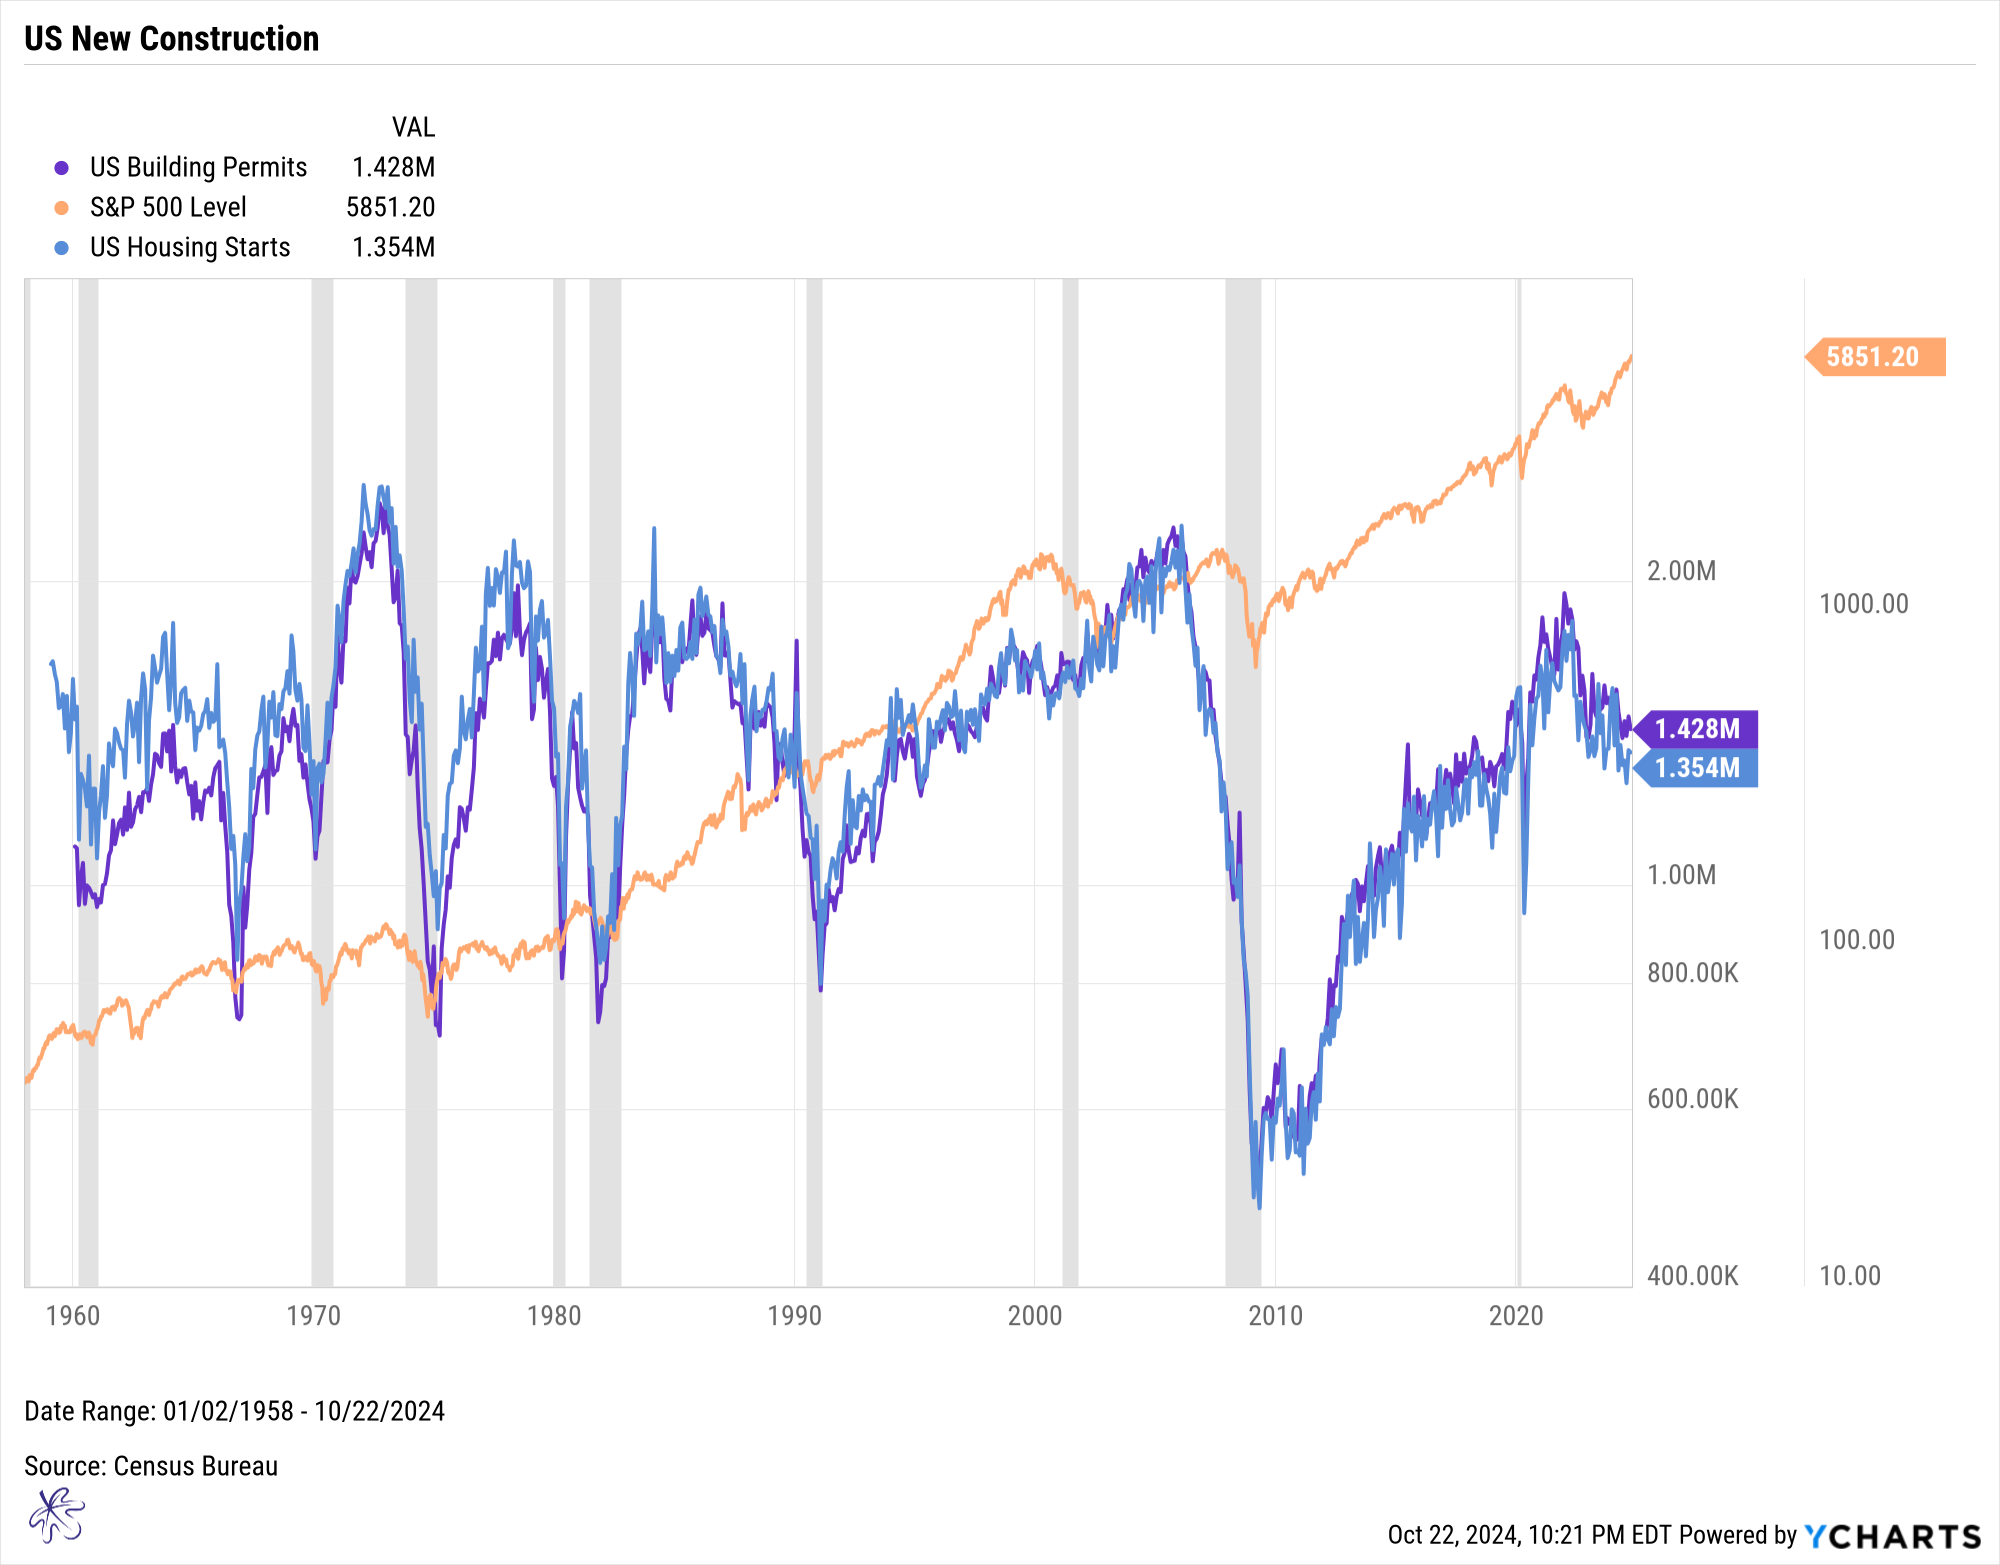
Housing starts and building permits are considered some of the most important leading economic indicators because they impact many other sectors of the U.S. economy. In fact, building permits are part of The Conference Board Leading Economic Index.
Consistent with previous recessions, we are seeing both building permits and housing starts decline significantly, as the uptrend has been meaningfully broken.
Even in 1966, when the economy avoided a recession, this indicator was correlated with a significant market decline. The S&P500 sold off from 94.06 on February 9, 1966, to 73.20 on October 7, 1966. This is a drop of 22.18%.
Key Takeaway: A declining housing market has a ripple effect, often serving as a prelude to broader economic turmoil.
For this time to be different, we would need to see stabilization, or even an increase, in housing starts and building permits without a corresponding recession or major market decline. But so far, the data just isn’t showing that.
Employment Landscape
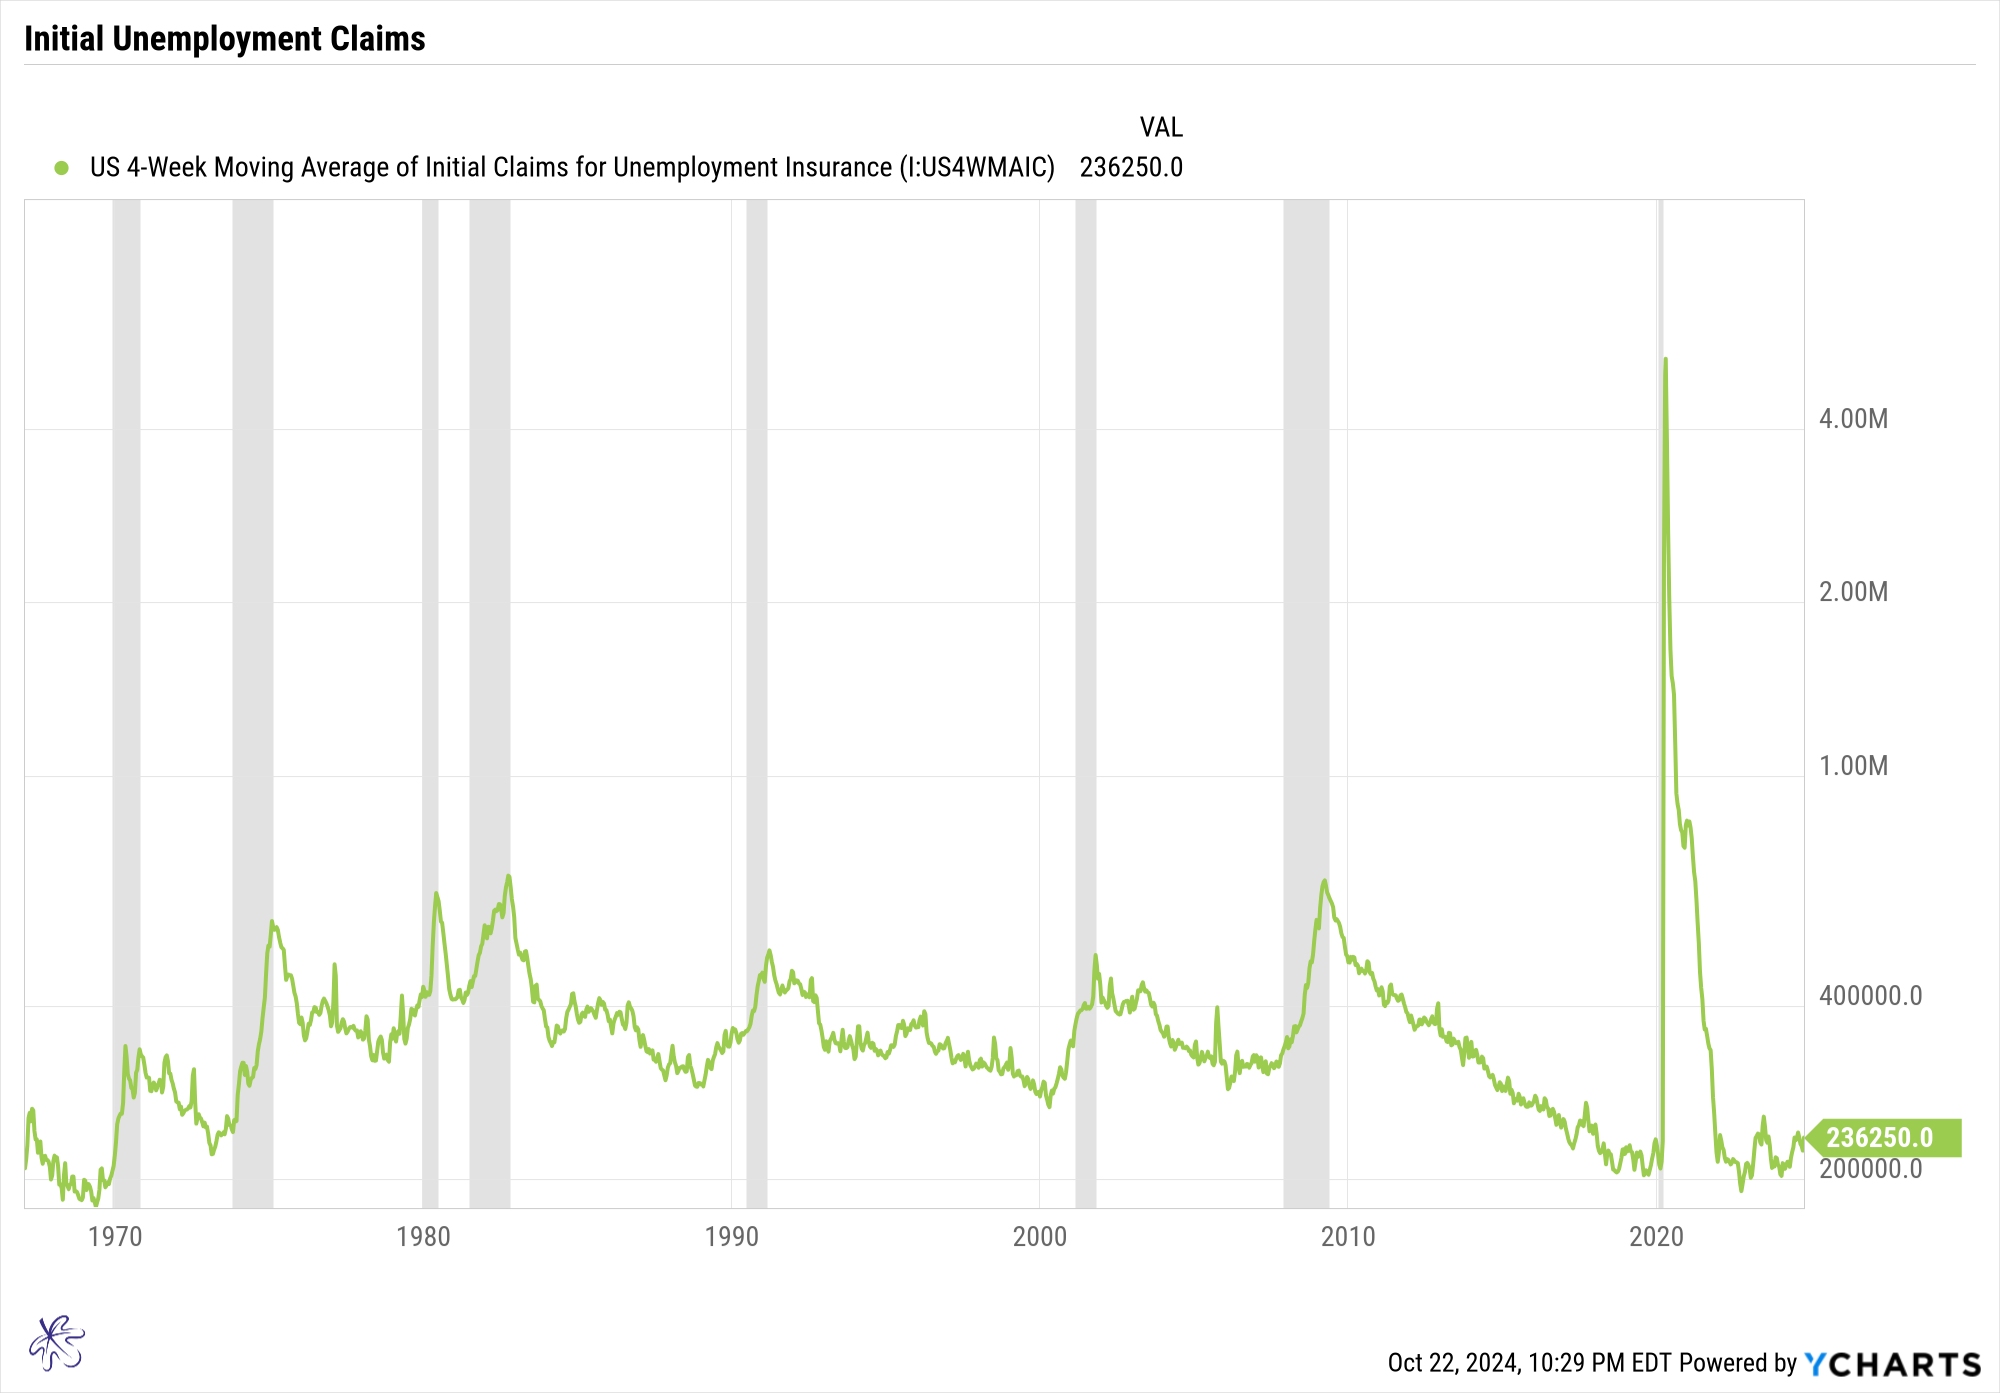
Of course, housing is not the only indicator flashing red. Let’s look at employment, a market darling that may not be as strong as it seems.
The main reason many are optimistic about the market is the strength of the U.S. employment landscape. And I agree; currently, the 4-week moving average of initial unemployment claims is near multi-decade lows. This suggests layoffs are not widespread.
But what is this really telling us? Looking at the chart above, we can see that unemployment claims often don’t start spiking until a recession is already underway. In fact, just before most recessions, initial claims were at multi-year lows. This is very similar to today’s situation.
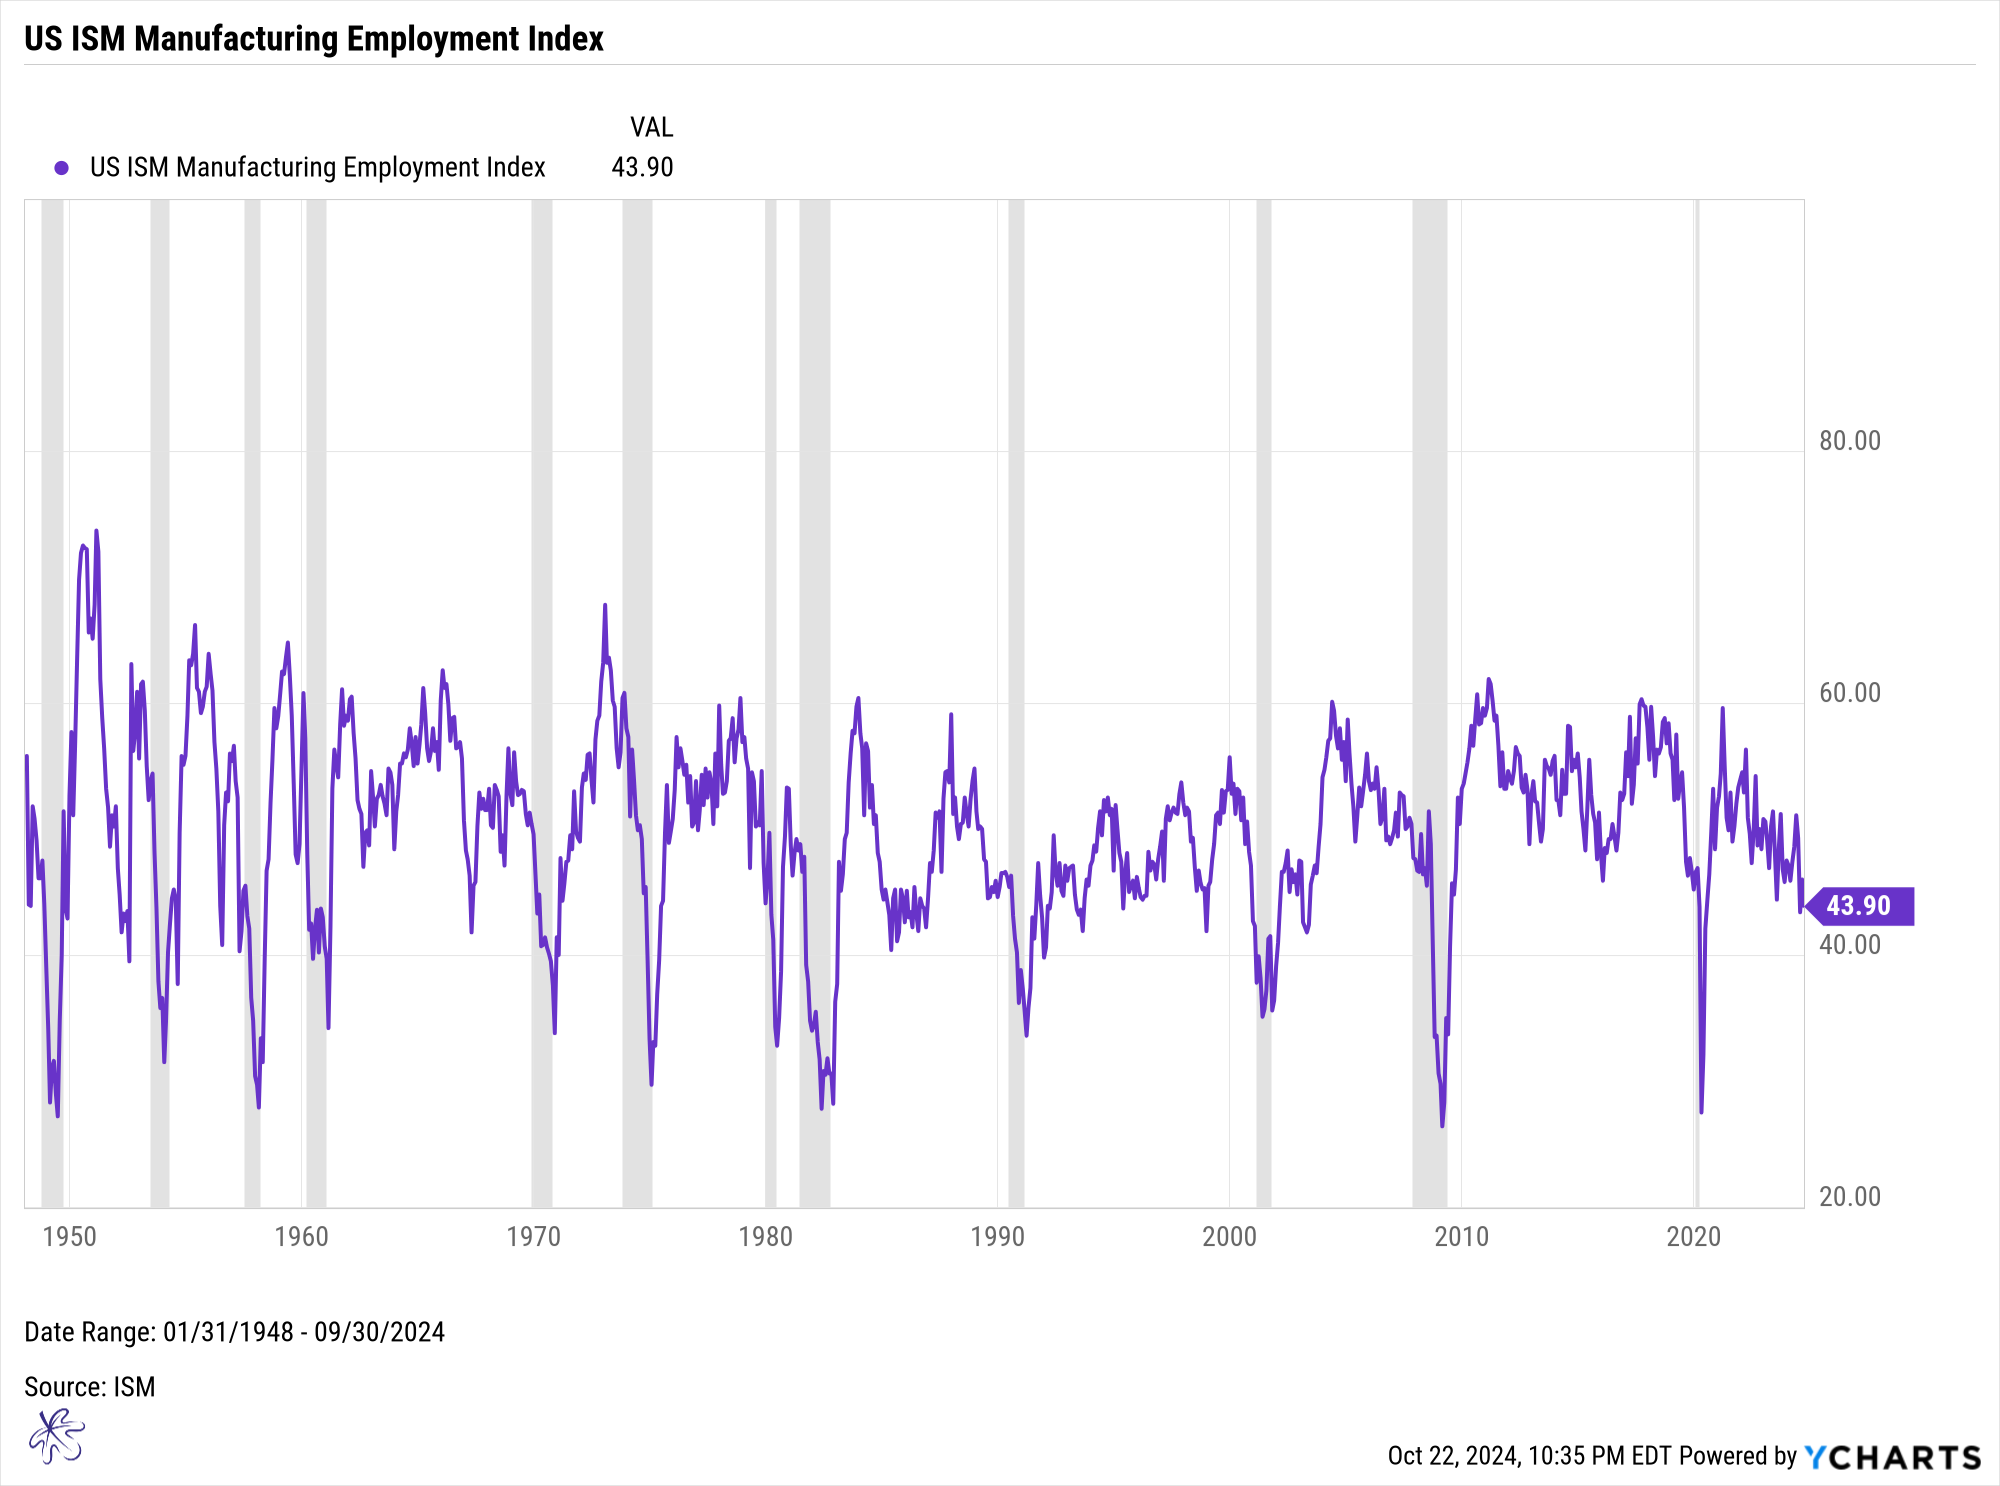
We can also look at the ISM Manufacturing Employment Index. Over the course of 12 recessions, dating back to the 1950s, we observe that the index does not start to significantly decline until a recession is already in progress. The lowest points in the index tend to occur in the later stages of each recession.
Key Takeaway: Employment data can be deceiving; it often tells us we’re in a recession only after it’s already begun.
Using employment data to claim “this time is different” displays a fundamental misunderstanding of economic and market mechanics. Employment data is more useful as a coincident indicator, telling us we are already in a recession rather than forecasting one. When we see spikes in unemployment, it usually means the recession is already happening, and this is confirmed retrospectively through GDP readings, which lag behind.
I’m not cheering for a recession. In fact, I secretly hope that all the bold claims about this time being different are correct.
I’ve never wanted to be wrong so badly.
But the reality is, the data suggests otherwise. The environment we are in today mirrors nearly every other recession in history. Stay objective, listen to the data, and don’t let confirmation bias cloud your judgment.
It’s not about being pessimistic; it’s about being prepared. Ignoring these indicators could mean missing out on crucial opportunities to help protect your portfolio or position yourself for what’s ahead.
As much as I’d love for the optimists to be right, wishful thinking has never been a reliable investment strategy. The best investors don’t bet on hope; they bet on data.
The most dangerous words in investing are still, “This time is different.”
Stay ahead of the curve. Keep listening to the signals and make informed decisions. If you’re interested in taking a deeper dive into the indicators driving the market or want actionable insights to navigate these uncertain times, sign up for my Substack. Let’s cut through the noise and focus on what I think really matters—data-driven strategies that work.
