Rate Cuts, Risk, and Reality: Simplifying Your Investment Strategy for FOMC Week
With the Fed’s highly anticipated rate cut decision just around the corner, markets are buzzing with speculation, but how should you position your portfolio when certainty creates new risks? In this week’s post, we break down what to expect from the FOMC, how Treasury yields are forecasting the future, and why having a solid risk management process is more critical than ever. Don't get caught off guard by market noise, simplify your strategy and stay ahead of the curve.
The Day Has Arrived: Anticipation of the FOMC Rate Cut
After months of speculation, the most highly anticipated day in the financial markets is almost here. Tomorrow, Wednesday, September 18, could set the tone for the rest of 2024, as the Federal Reserve is expected to make a critical decision on interest rates.
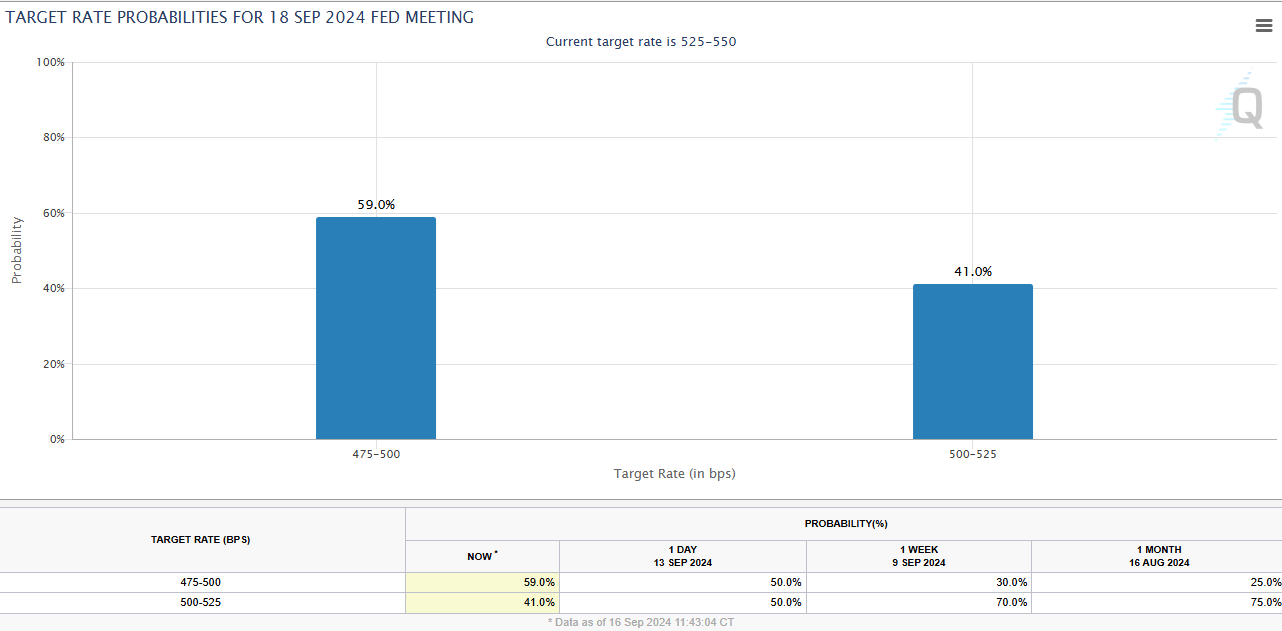
Source: CME Group FedWatch Tool
The market is fully expecting the FOMC to cut the Federal Funds rate, currently at 5.25-5.50%, by at least 25 basis points (bps) tomorrow, according to the CME FedWatch Tool. (A basis point is one hundredth of a percent, often used to describe small rate changes, so a 25 bps cut means a 0.25% reduction in rates.) What's changed is that there is now a greater probability the FOMC might cut by 50 bps, instead of the previously expected 25 bps.
The chart above illustrates how this expectation has evolved over the past month. A month ago, there was a 75% chance of a 25-bps cut. Last week, it was split 50/50 between a 25 and 50 bps cut. Today, there's a 59% probability of the larger 50-bps cut.
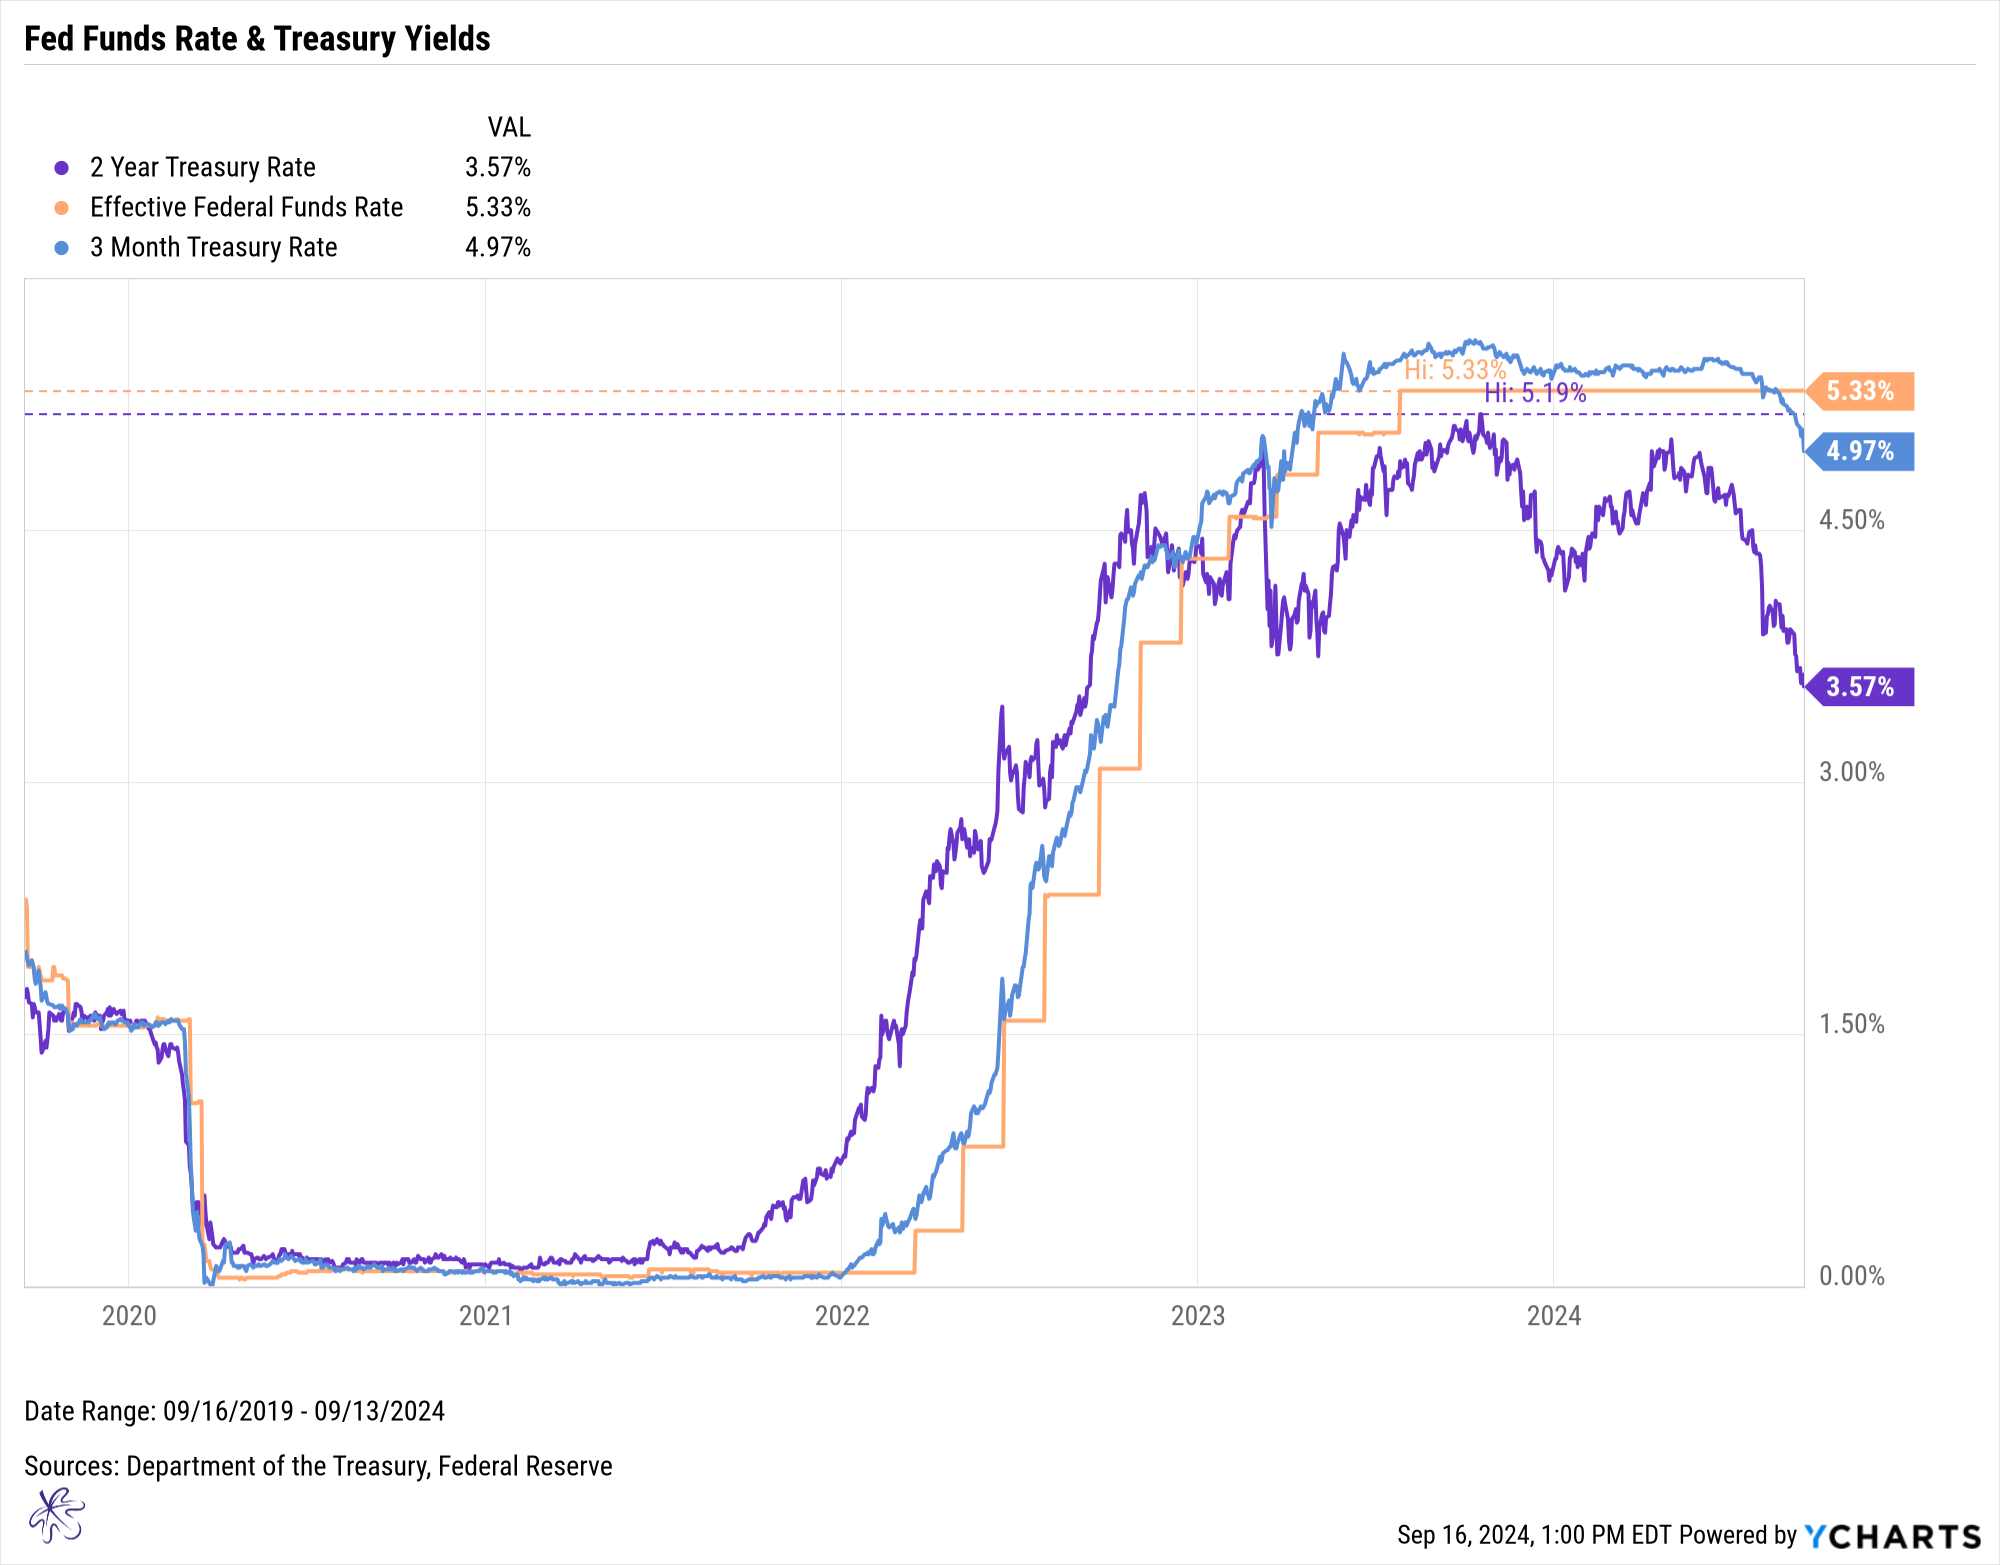
Even the Treasury market is reflecting this shift in expectations. The chart also shows the 2-year Treasury yield (purple), the 3-month Treasury yield (blue), and the effective Federal Funds rate (orange).
Notice how the 2-year yield leads the group, followed by the 3-month yield, and finally, the Fed Funds rate. This suggests that the 2-year yield is projecting market conditions 6 to 9 months ahead of the 3-month yield, which in turn slightly leads the Fed Funds rate. This pattern played out in late 2021 and into 2022.
Today, we’re witnessing the opposite scenario. The 2-year Treasury yield has broken through recent lows, and despite its volatility, the 3-month Treasury yield has now fallen below the effective Fed Funds rate for the first time since the Fed began hiking rates in early 2022. This signals suggests that the Fed will indeed lower rates tomorrow.
Managing Risk Amid Market Certainty
When markets operate under such high levels of certainty, the question of risk becomes paramount. If you ask most portfolio managers what risk is, they’ll often cite portfolio volatility or the standard deviation of returns. But the real risk is positioning your portfolio for a scenario you expect, only for the event to happen and your investments not behaving as anticipated.
In this case, I believe equity markets have been rallying on the expectation of a rate cut. But if you're following the crowd, how do you know it's the right position to stay long? The reality is that equity markets have likely already priced in a rate cut, so what upside is left if the FOMC simply delivers what the market expects?
This week, the news will be full of speculation about what the FOMC will do, how the market will react, and when the next rate cut might happen. I’m already seeing reports on how a rate cut could impact equity markets (more on that Thursday!). There’s also the inevitable question: If the FOMC cuts rates, will they have to raise them again if inflation rises?
Simplifying the Risk Management Process
To effectively manage your investment risk, you need to simplify the process. Let’s create a simple risk management framework:
First, observe how forward-looking Treasury yields drive market scenarios. For instance, if the 2-year yield turns higher, watch for the 3-month yield to follow. As long as the 2-year and 3-month yields continue to fall, there's a high probability that rates will move lower. Once the Fed Funds rate catches up, we could see a pause.
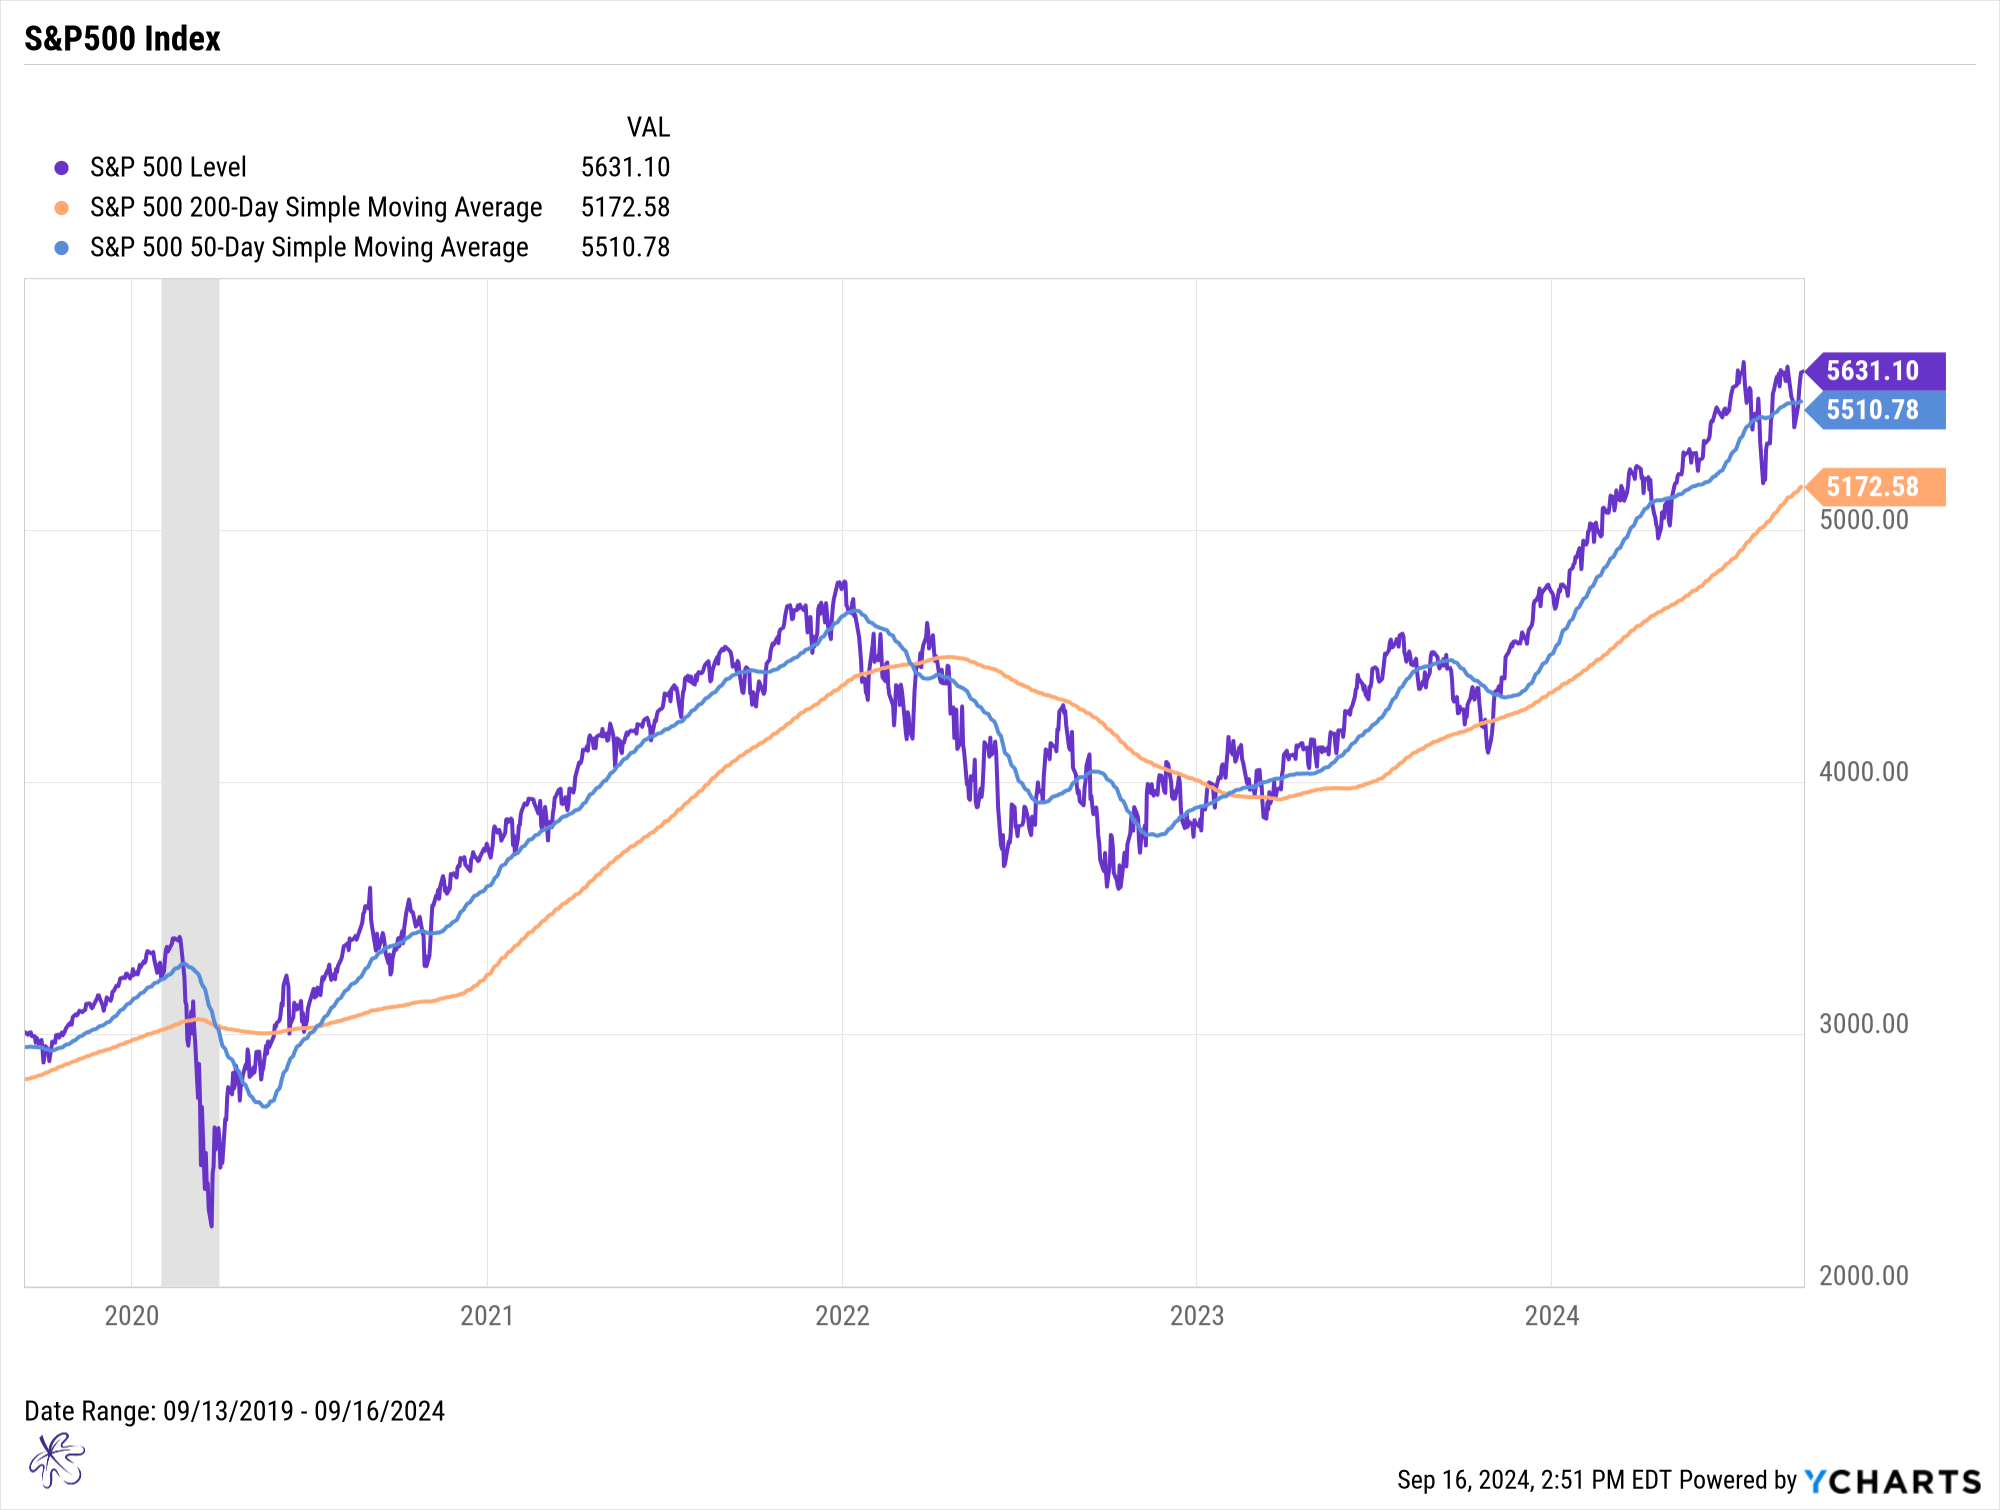
Next, design a system around your investments to help decide whether to stay invested or exit a position. For example, let’s use the S&P 500 index as a proxy. I’ve overlaid the index with two moving averages: the 50-day simple moving average (blue) and the 200-day simple moving average (orange). The market trends higher when it's above these averages and lower when it’s below them. This is a form of time series momentum.
A common strategy is to own the position when the market is above the moving average and exit when it’s below. Short-term moving averages can reduce downside risk but may lead to more frequent trading. Longer-term averages offer less downside protection but reduce the number of signals your system generates.
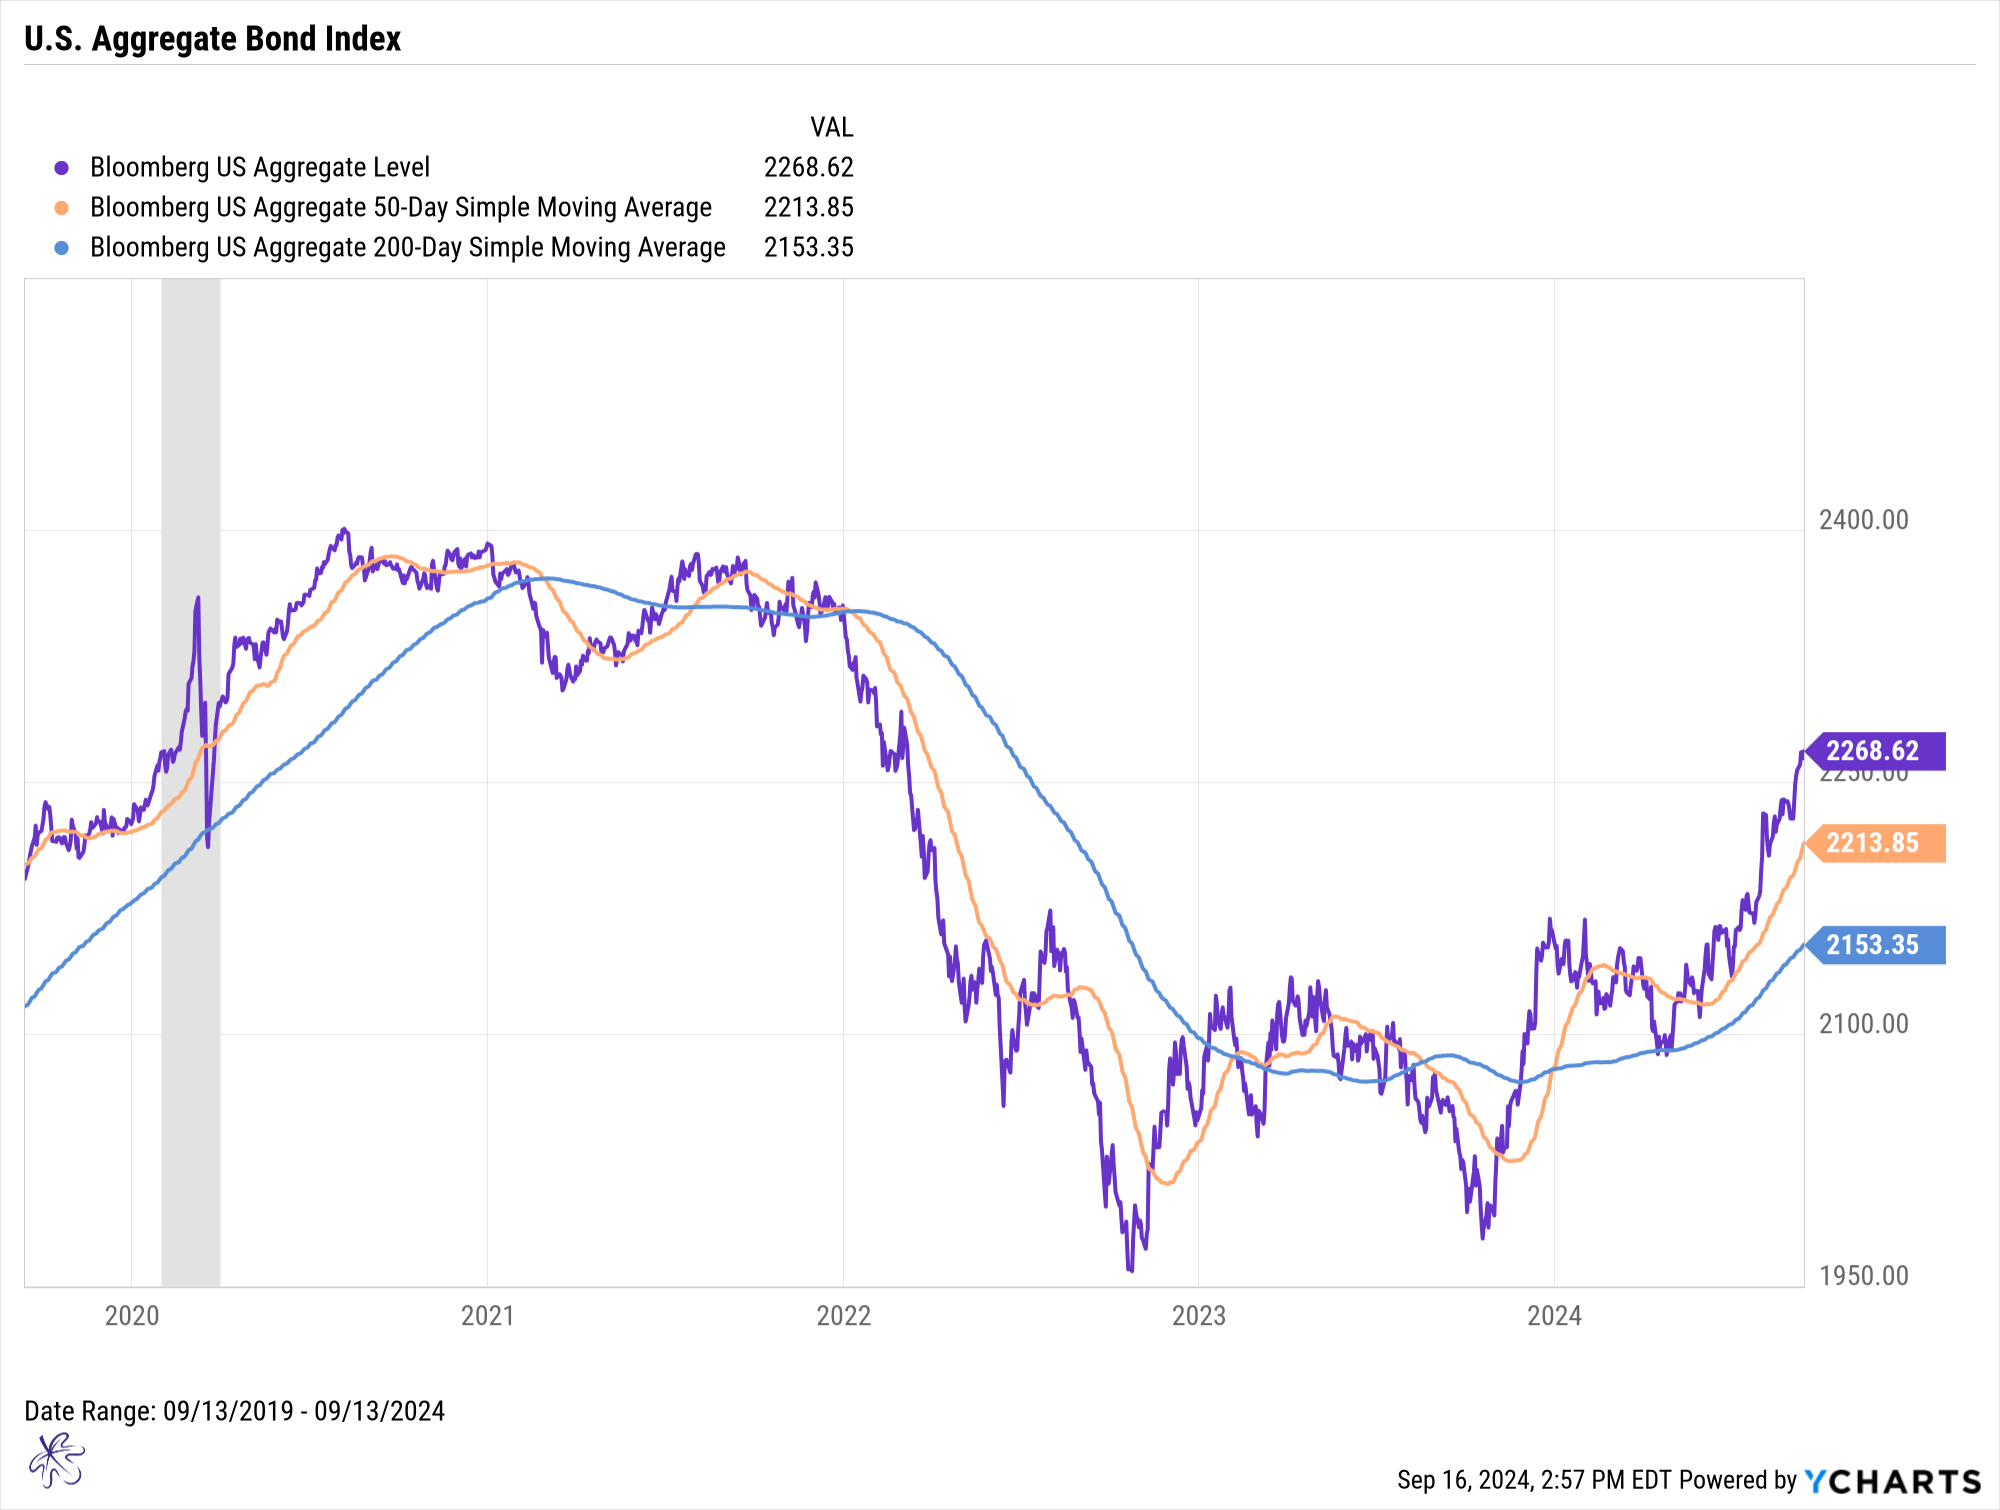
If your primary risk control triggers a sell signal, you don’t have to sit in cash. This is where many risk-control strategies fall short. Consider alternative investments with a better risk-reward profile. For example, you could compare the Aggregate Bond Index to see if it's trading above or below its moving averages. When comparing two asset classes, we’re using cross-sectional momentum.
Expect Volatility, Manage Expectations
This week is expected to be volatile, with a lot of noise. This increases the risk of becoming overly tied to a specific thesis. Sometimes, the market doesn’t react the way we expect, and that’s the real risk for our portfolios.
By stepping back, filtering out the noise, and focusing on objective, data-driven signals, you may be able to better manage risk in your portfolio.
Remember, this isn’t the only way to construct a process, but any process is often better than no process at all.
