S&P500 is walking a fine line with the moving averages
Weekly and daily Bollinger Bands are serving as key resistance and support levels for the S&P500 index and may provide important insights into what we should be watching for.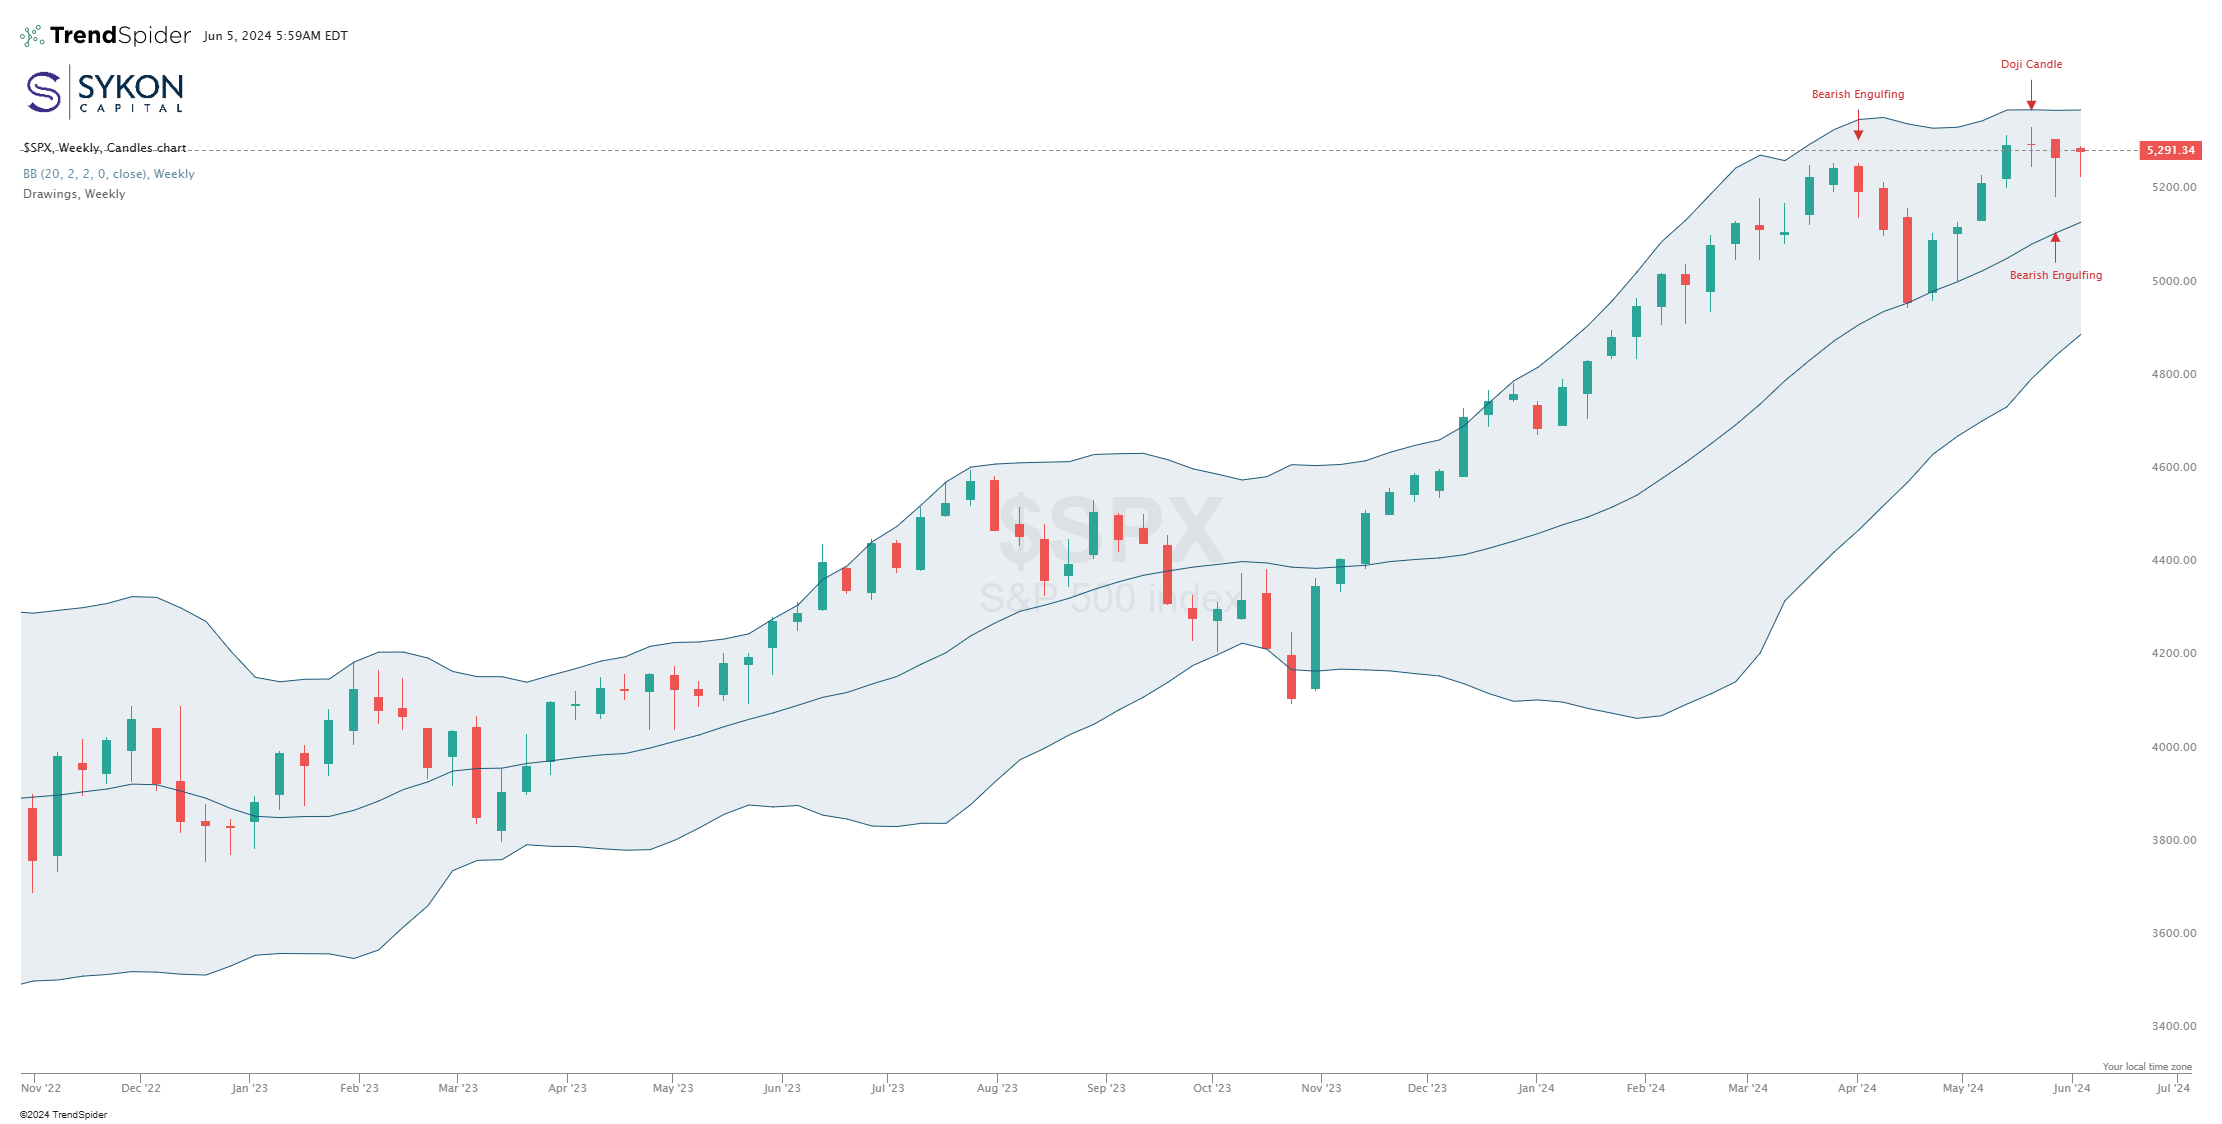
This chart represents the S&P500 index weekly chart. Three weeks ago the index put in a doji top candle. This candle usually indicates the market is undecided about direction as the open and close are almost the same. The following week the index experienced a bearish engulfing candle. This type of candle is particularly bearish in the week that follows a doji candle.
The bearish engulfing pattern that occurred in early April led to a 5.6% decline over just three weeks. The index eventually found support at the middle Bollinger band.
The upper Bollinger band will continue to serve as a key resistance level around 5377. A break above this level will be bullish and indicate higher prices may be likely. Just like the scenario that occurred in April, the middle Bollinger band will be the likely level of initial support. This sits at 5138. A break here can put the lower band in play at 4898.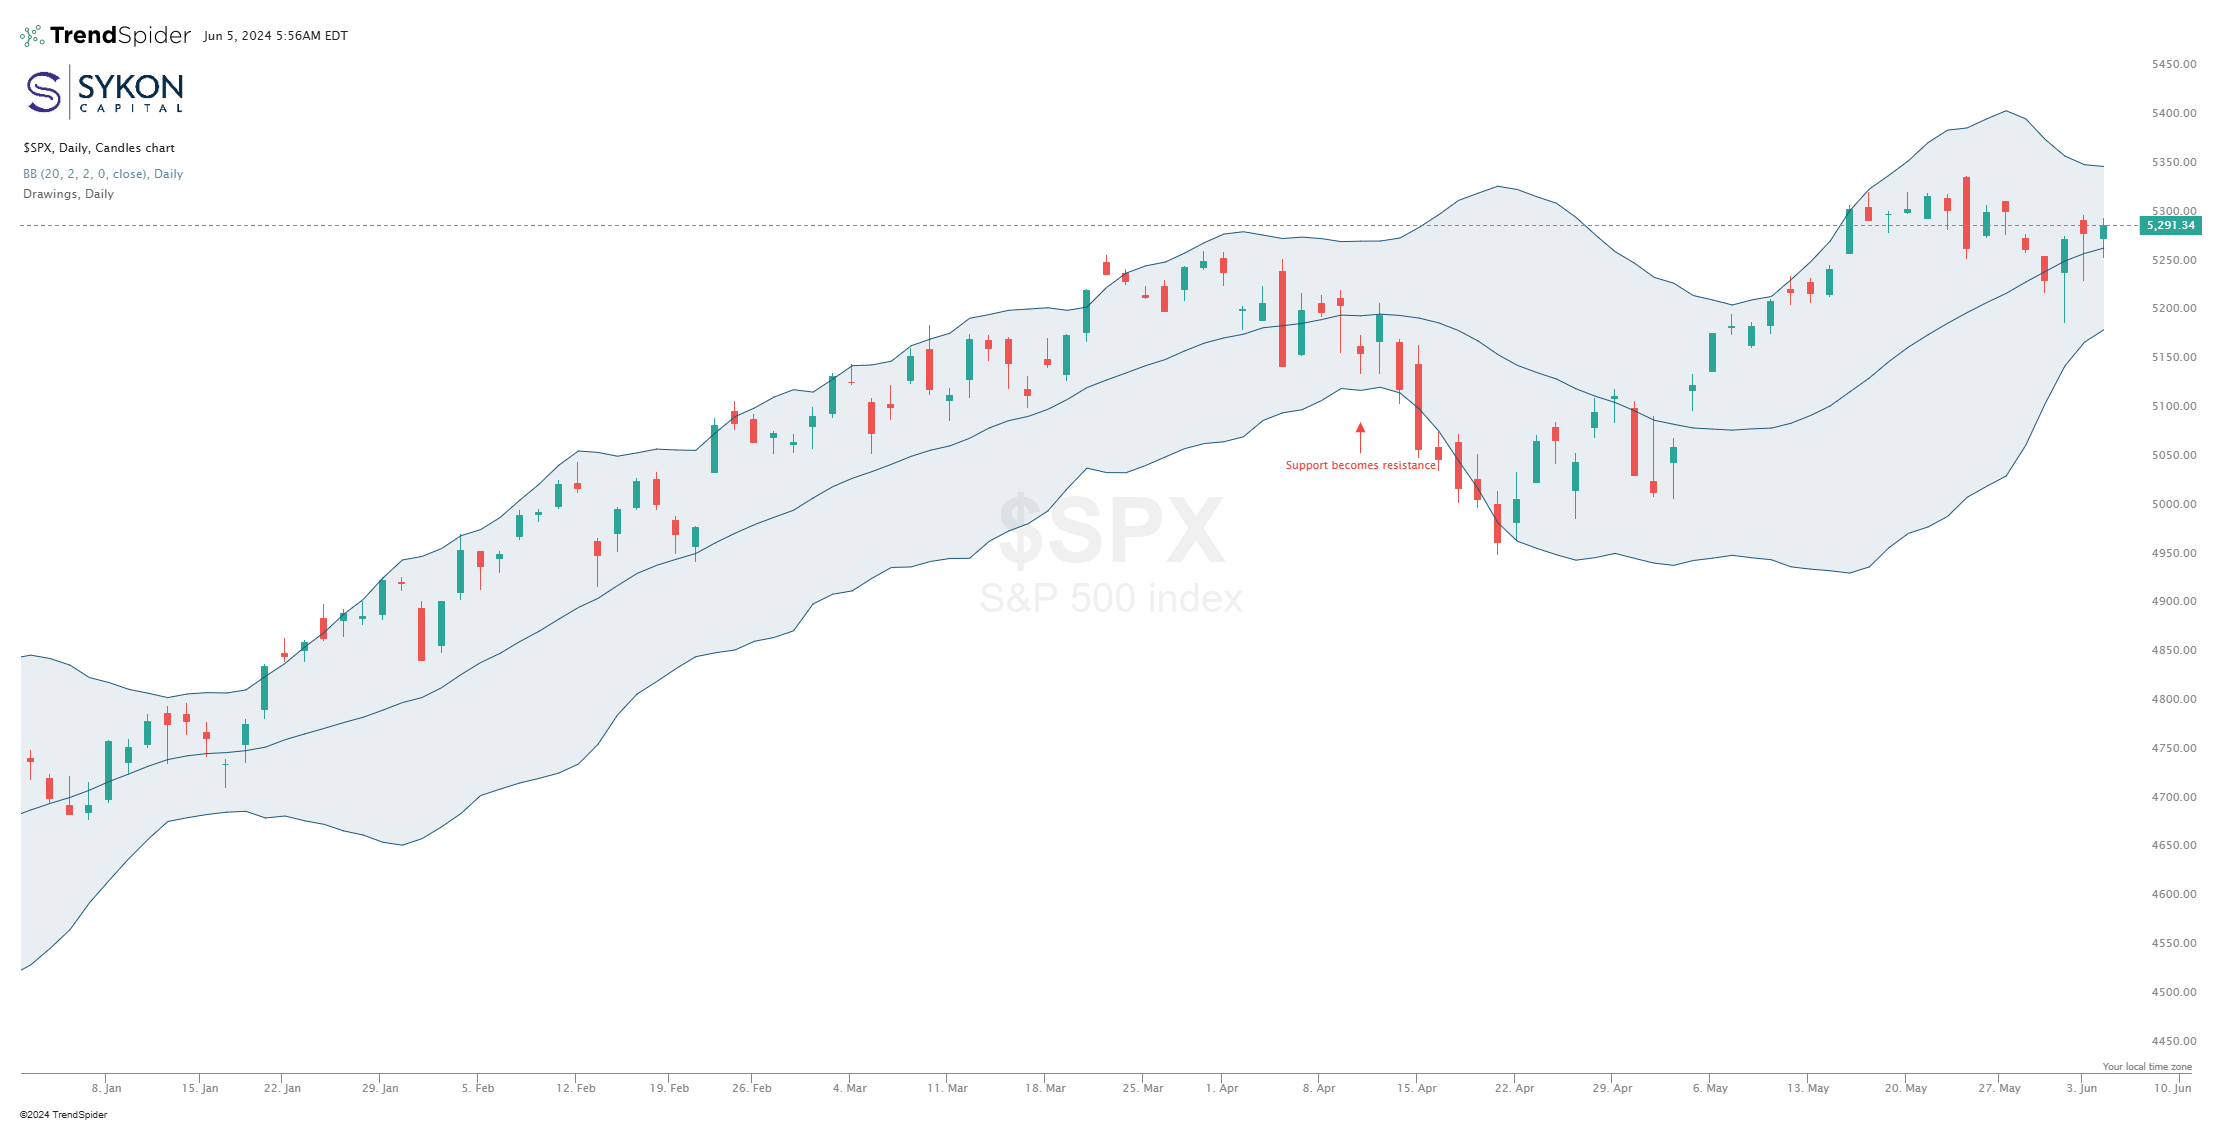
We continue to see similarities between early April and the current market environment when we zoom into the daily charts. Back in April, the index broke the support at the middle band, which then became overhead resistance. It then rode the lower band down to the market lows in late April.
Today, this middle Bollinger band is serving as a key support level in our opinion, for the index. Over the past three trading sessions, the lower candle wicks have all moved markedly below the middle band before recovering. This break in the middle band at 5262 can be a catalyst that drives the weekly chart lower to the middle band.
Interestingly, the lower Bollinger band at 5172 aligns closely with the middle Bollinger band of the weekly chart. A break in the lower band will be an indicator that the middle band of the weekly charts are likely to break as well.
