The Long Road to Recovery: Lessons from Historic Market Declines
You’ve heard it before: 'The market always recovers.' But what if that’s not always true? In this article, we’ll explore two major market crashes that took decades to rebound from and how you can help protect your portfolio from tail risks and Black Swan events.
Just today, I saw a post claiming that the market has never been negative over any 11-year period.
This is not the case. HARD STOP.
In fact, I’m going to show you two examples where the market took much longer to recover. One took 34 years, and the other took 15 years.
Nikkei 225 index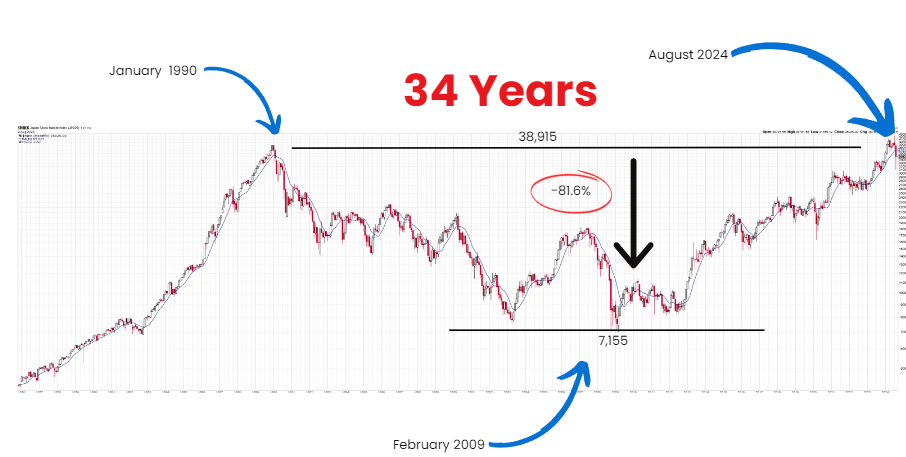
Source: StockCharts.com
From January 1990, the Nikkei 225 peaked at 38,915 and declined over the next 19 years to a low of 7,155, losing over 81% of its value. Even as of 2024, it still hasn't returned to its 1990 peak, illustrating that major market declines can last far longer than many anticipate.
Think about this. If you were 40 in 1990, this means that almost every dollar you invested into this index lost value over the next 19 years, until you were 59. In fact, you would still not have recovered your drawdowns at the age of 74.
Now imagine you were 60. There’s a good chance the market wouldn’t have recovered in your lifetime.
I can hear the chatter already: "This can never happen with U.S. equity markets." Sorry to burst the bubble, but it did.
Nasdaq Composite Index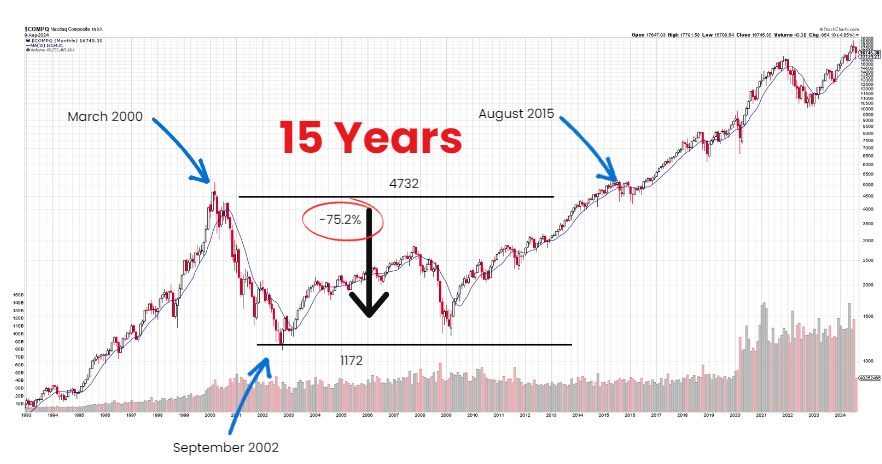
Source: StockCharts.com
The Nasdaq Composite index peaked at 4,732 in March 2000. It bottomed over two years later, in September 2002, at 1,172, representing a massive 75% decline from the peak. The index did not fully recover for 15 and a half years, until August 2015.
Imagine you were about to retire at 60 or 65; the market didn’t recover until you were 75 or 80 years old.
I’m not going to debate the merits of why these declines happened. We just have to accept that they did. The reality is that social media and even researchers like to throw out statistics about how rare certain events are, but these events have happened before—and there’s a high probability they will happen again.
Events that initiated these drawdowns, like the dot-com bubble burst or the Great Financial Crisis, are often considered tail-risk events or Black Swan Events. The term "Black Swan" comes from the idea that people assumed black swans didn’t exist because no one had ever seen one. But this is a dangerous assumption—eventually, explorers did discover black swans.
As it relates to markets, just because something hasn’t occurred in the past doesn’t mean it can’t happen in the future.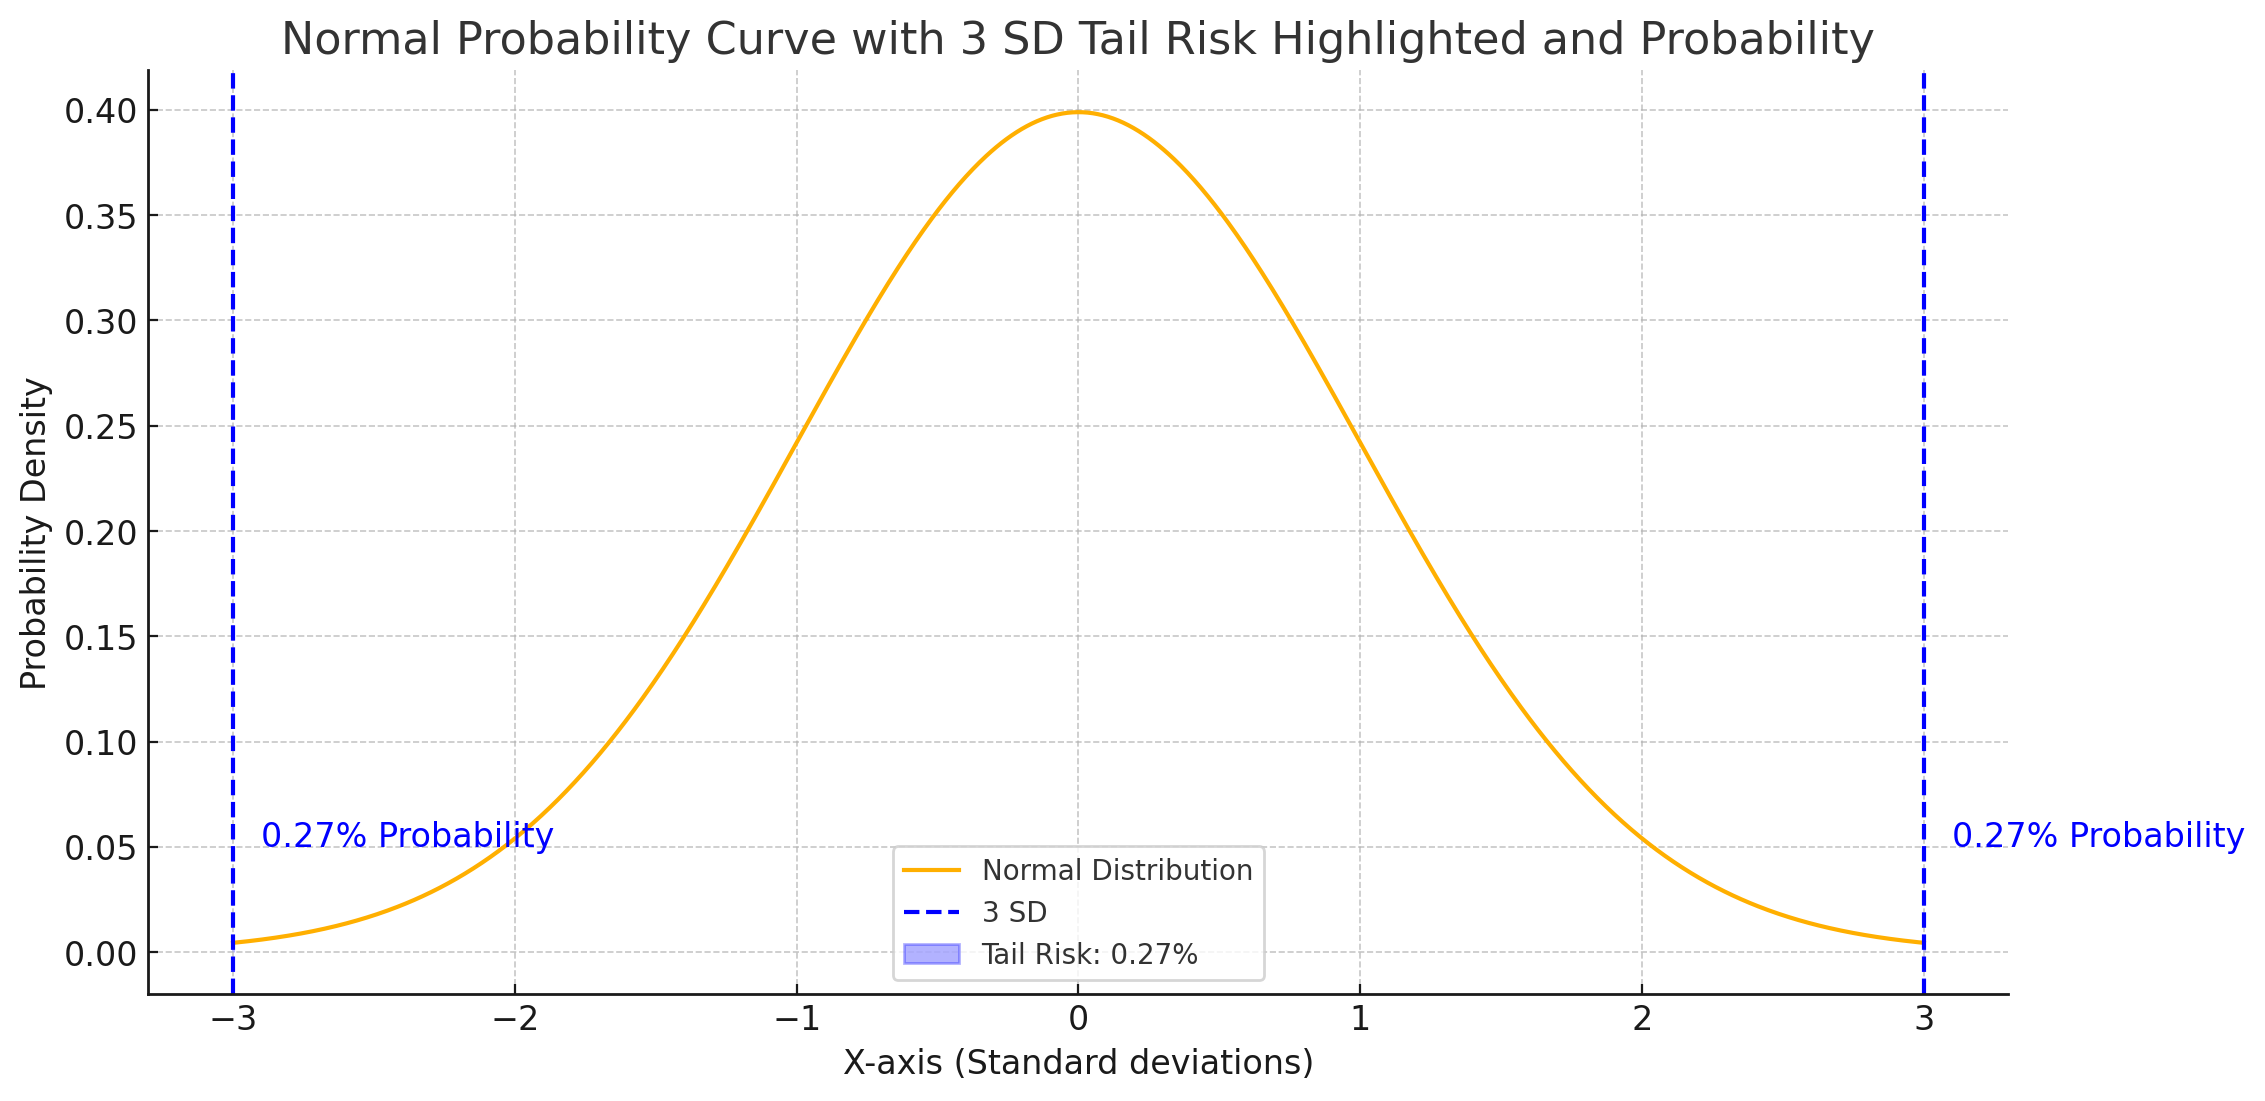
Tail risk is crucial because it represents an event that has a small probability of happening, but its impact can be immense. In a normal probability curve, a three-standard-deviation event has just a 0.54% chance of occurring, yet the damage to a portfolio can be significant.
How does this relate to the investment markets?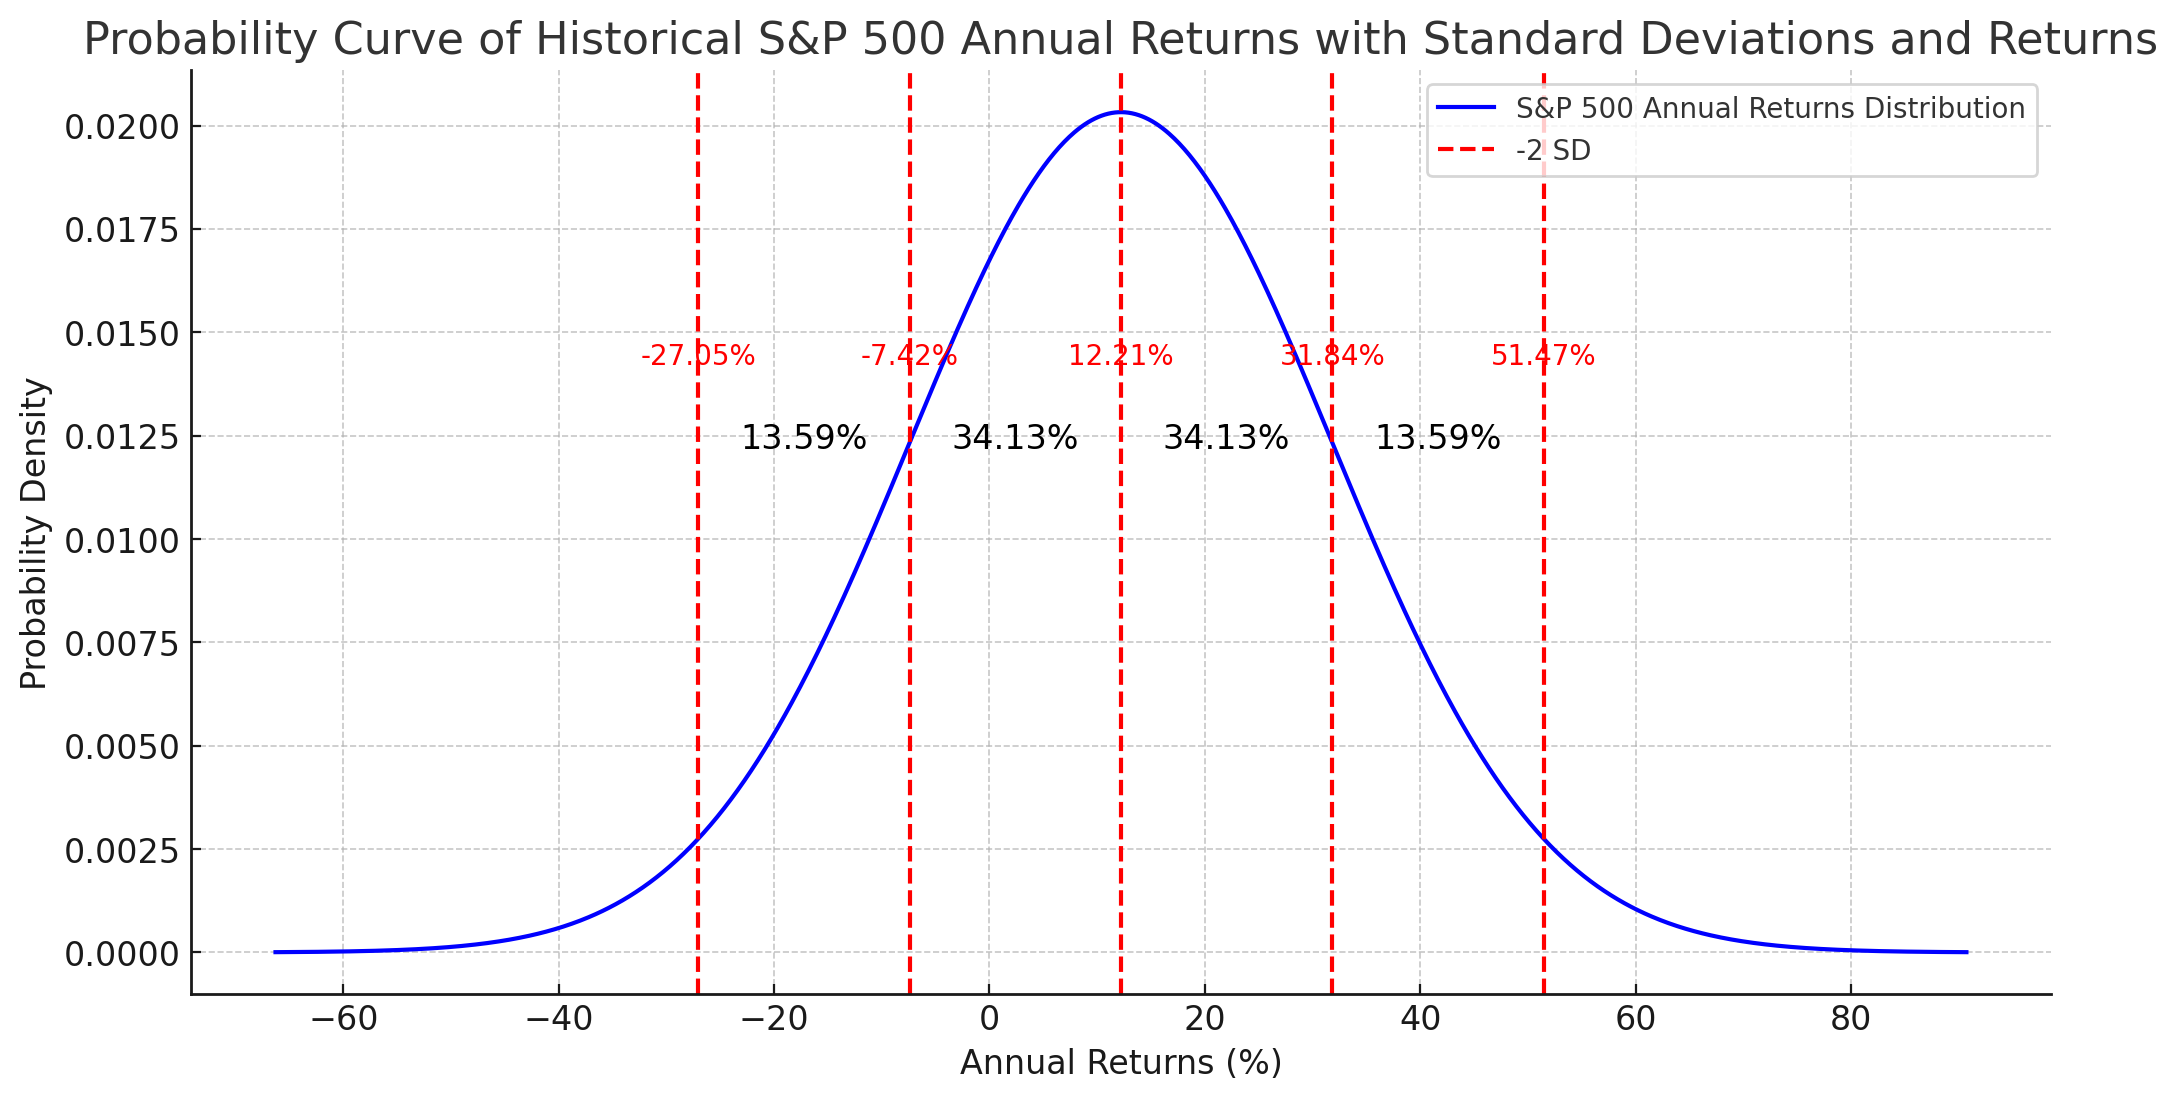
Source: YCharts, S&P 500 annual returns from 1926 through 2024
Since 1926, 68.26% of annual returns for the S&P 500 have landed between -7.42% and 31.84%. Meanwhile, 95% of returns have landed between -27.05% and 51.47%. This means that 2.5% of the time, returns have been below -27.05%.
When we create risk management tools for a portfolio, we’re threading a fine needle—allowing our portfolios to function in the normal range of volatility (e.g., within one standard deviation of drawdown), while attempting to minimize losses as we move into the 2, 3, and 4 standard deviation events. These moves are often so large that it takes a significant event to spark them. When these Black Swan moves occur, markets struggle to price assets accurately due to the lack of historical precedent.
This is why we say, “Let the prices lead and the fundamentals follow.” Using technical indicators to help manage risk can be one of the most effective tools to protect against tail events that the market hasn’t experienced before.
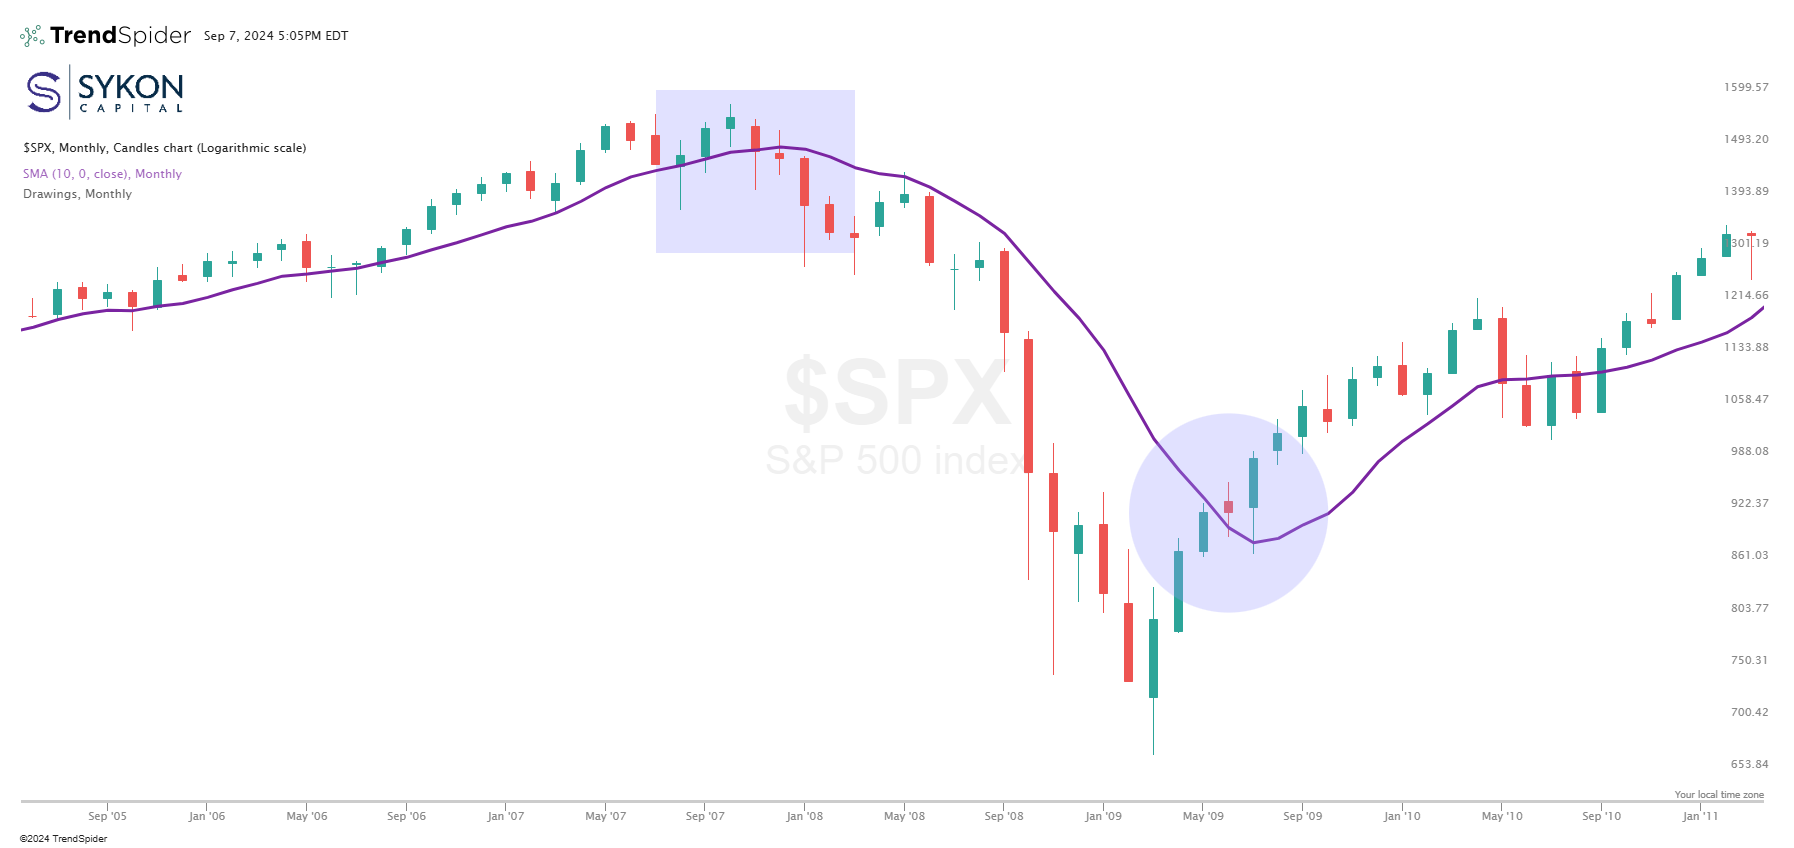
Above is a monthly chart of the S&P 500 from September 2005 through January 2011. The purple line represents the 10-month simple moving average of the S&P 500 index. When the index is above this line, it tends to rise. When it’s below this line, it tends to fall. Leading up to the Great Financial Crisis, the S&P 500 crossed below this moving average in November 2007. The close at the end of November was 1,481.14 (see rectangle). The index stayed below this line until it crossed back above in June 2009, when the index closed the month at 919.32 (see square).
The difference between these levels was 37.93%. Technical indicators, like moving averages, help investors stay objective during times of uncertainty, allowing them to identify key trends and adjust portfolios accordingly. While no strategy is perfect, incorporating technical analysis into portfolio management can help mitigate the impact of unexpected market events.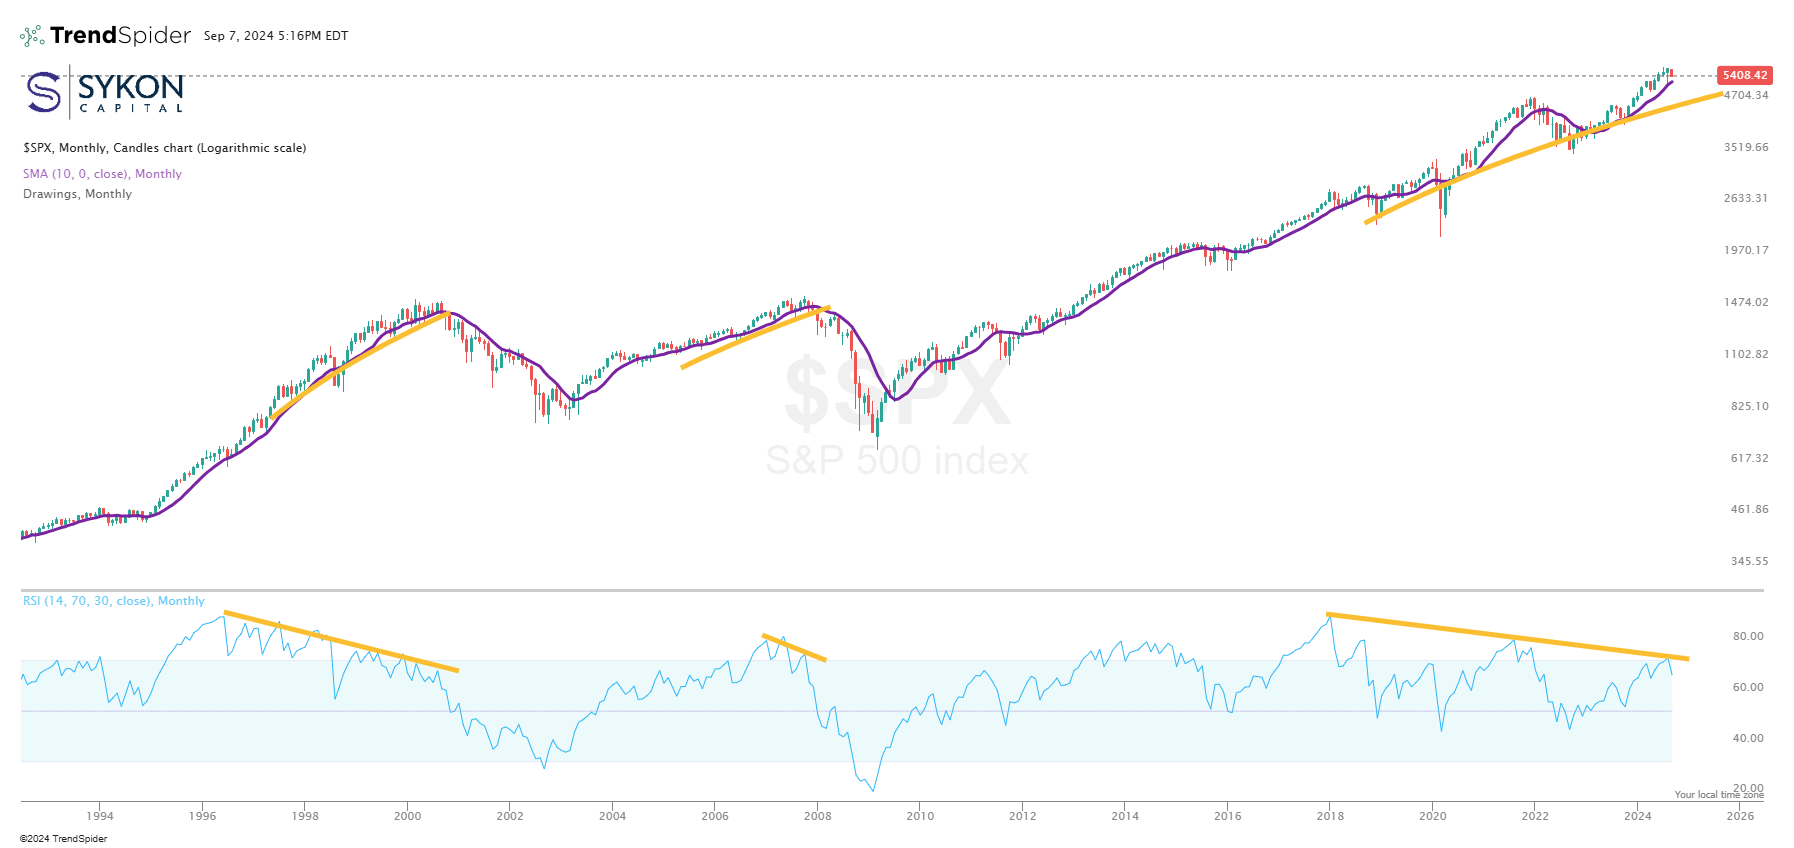
Concerns around Black Swan events are especially relevant today because we’re seeing long-term bearish divergences consistent with previous tail-risk scenarios. Preceding the dot-com bubble burst and the Great Financial Crisis, the S&P 500 index consistently made new highs on monthly charts, while the Relative Strength Index (RSI) made lower highs.
As of September 6, 2024, the S&P 500 index closed at 5,408.42, and the 10-month simple moving average is 5,231.89.
In upcoming articles, we’ll dig deeper into the risk management process we use at SYKON Capital.
To get regular insights on how we manage risk and navigate today’s complex markets besure to subscribe on our insights page.
