The Recency Trap: How to Stay Focused Amid Market Noise
With the market’s endless headlines screaming about the latest moves - rate hikes, inflation fears, economic data - you name it, it’s easy to lose track of what really matters. The truth? Most of it is just noise. As investors, the challenge is cutting through the chaos and focusing on what we believe truly counts: the signals hidden in the charts. Today, we’ll dive into two key areas, the Chinese stock market and the S&P 500, to filter the noise and focus on real opportunities (and risks).
But before we get into the data, let’s talk about recency bias, a common behavioral trap. Recency bias makes us believe that recent trends will continue indefinitely. Markets have been riding high, and the weekly S&P 500 chart hasn’t broken below the middle Bollinger Band for almost a year. It’s easy to fall into the trap of thinking this will last forever. Spoiler: It won’t. Here’s how we can avoid this bias, stay grounded, and manage risk smartly.
Chinese Stock Market
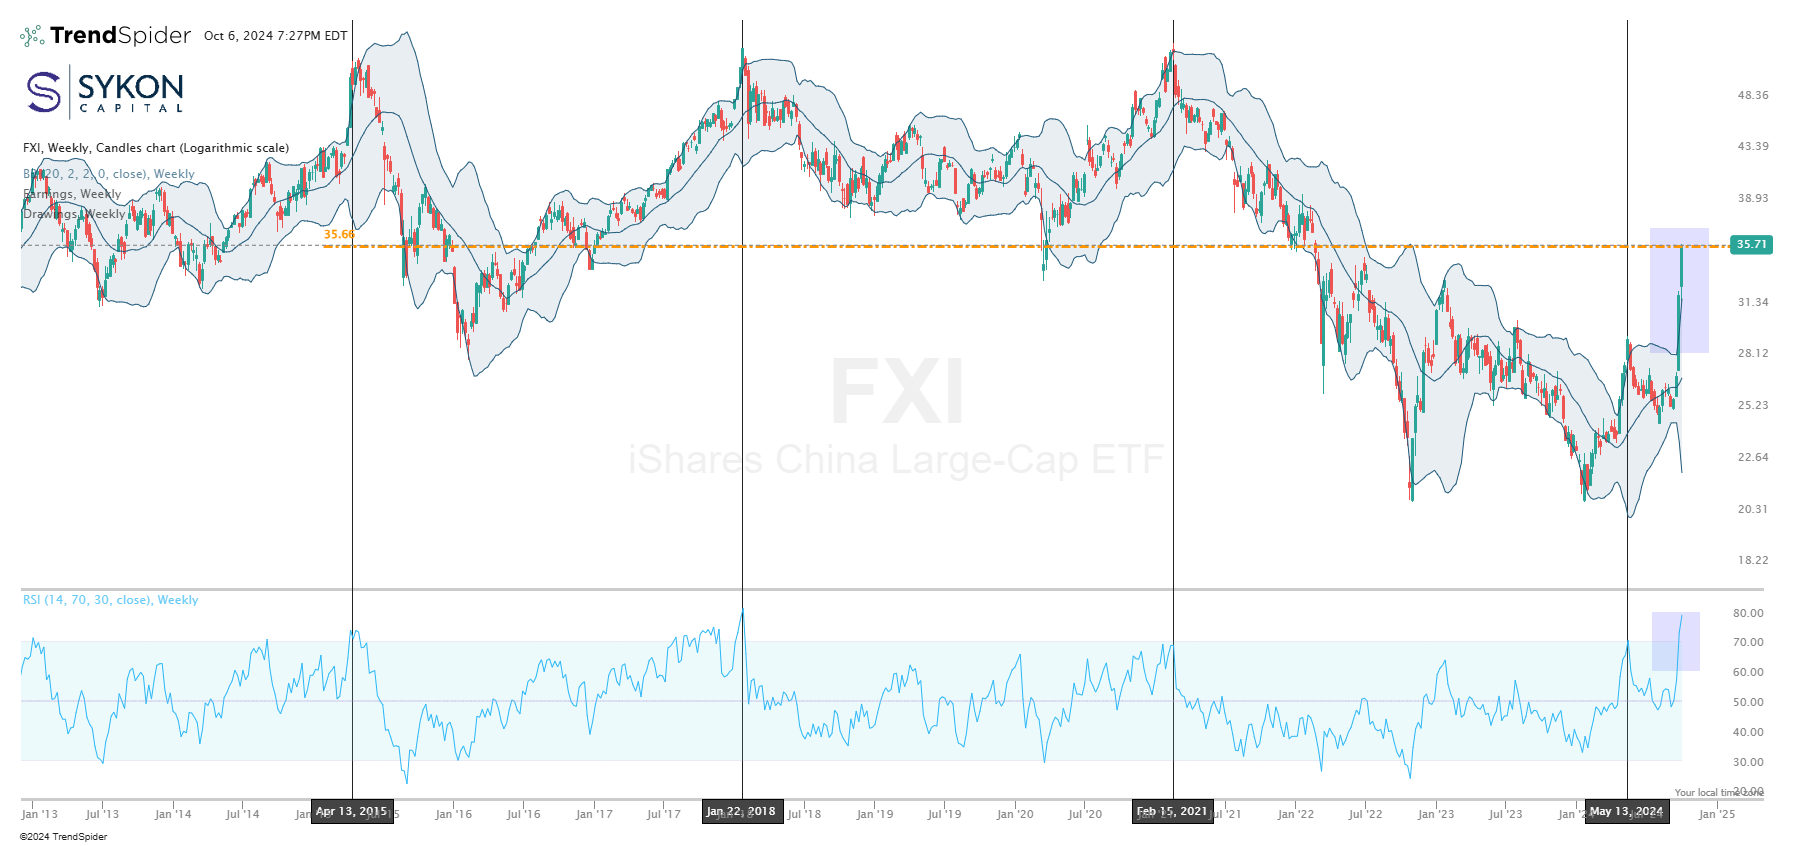
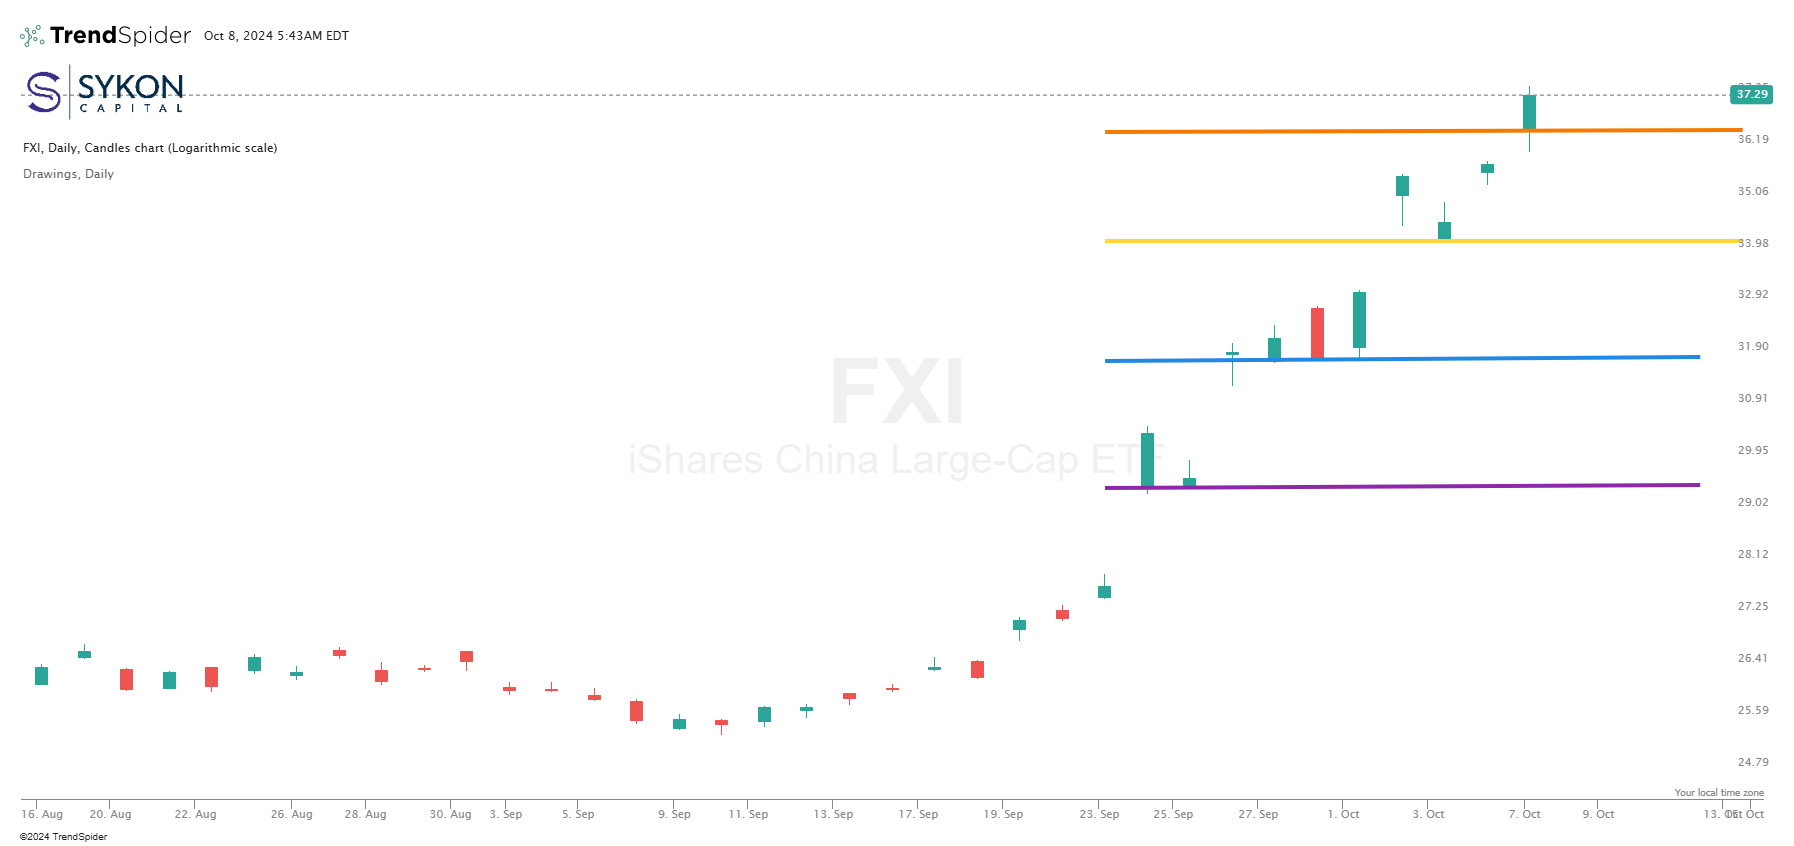
Last week, I pointed out that the Chinese stock market was overextended on the daily charts (See: What’s Next for Chinese Stocks? How to Position Your Portfolio). Despite being stretched by historic standards, the market held support at the 31.70 zone and continued moving higher. Now, this recent push has overextended the weekly charts.
On Friday, the Relative Strength Index (RSI) hit 78.92 on the weekly chart. With the additional gap Monday, the weekly chart is pushing an RSI close of over 80. For those less familiar, RSI measures the speed and change of price movements. When it pushes past 70, that typically indicates an overbought market, time to pay attention. Add to that the reality that the chart has extended beyond the upper Bollinger Band, a volatility indicator that shows when prices have moved too far too fast. We’re also running into overhead resistance, marked by the orange dashed line.
Historically, when RSI hits 70+ and the candles extend above the upper Bollinger Band, the market tends to correct - often significantly. Here’s a breakdown of the last four times this happened:
| Close | Low | Date | % Change | |
| 4/13/15 | 50.03 | 29.06 | 2/8/16 | -41.91% |
| 1/22/18 | 53.98 | 34.37 | 5/16/20 | -36.33% |
| 2/15/21 | 53.60 | 21.53 | 10/24/22 | -59.83% |
| 5/13/24 | 29.34 | 25.20 | 7/29/24 | -14.77% |

Given the size of previous declines, it’s a good idea to employ risk protection strategies. This could include setting protective stops or using protective puts to manage risk if prices start to reverse. The above levels are:
- 36.55 at the orange band
- 34.16 at the yellow band
- 31.74 at the blue
- 29.40 at the green band.
If the position continues to move higher, adjust your stop levels accordingly on the way up. The last thing you want is to be caught in another major sell-off without a plan.
S&P 500 Maintains Its Channel

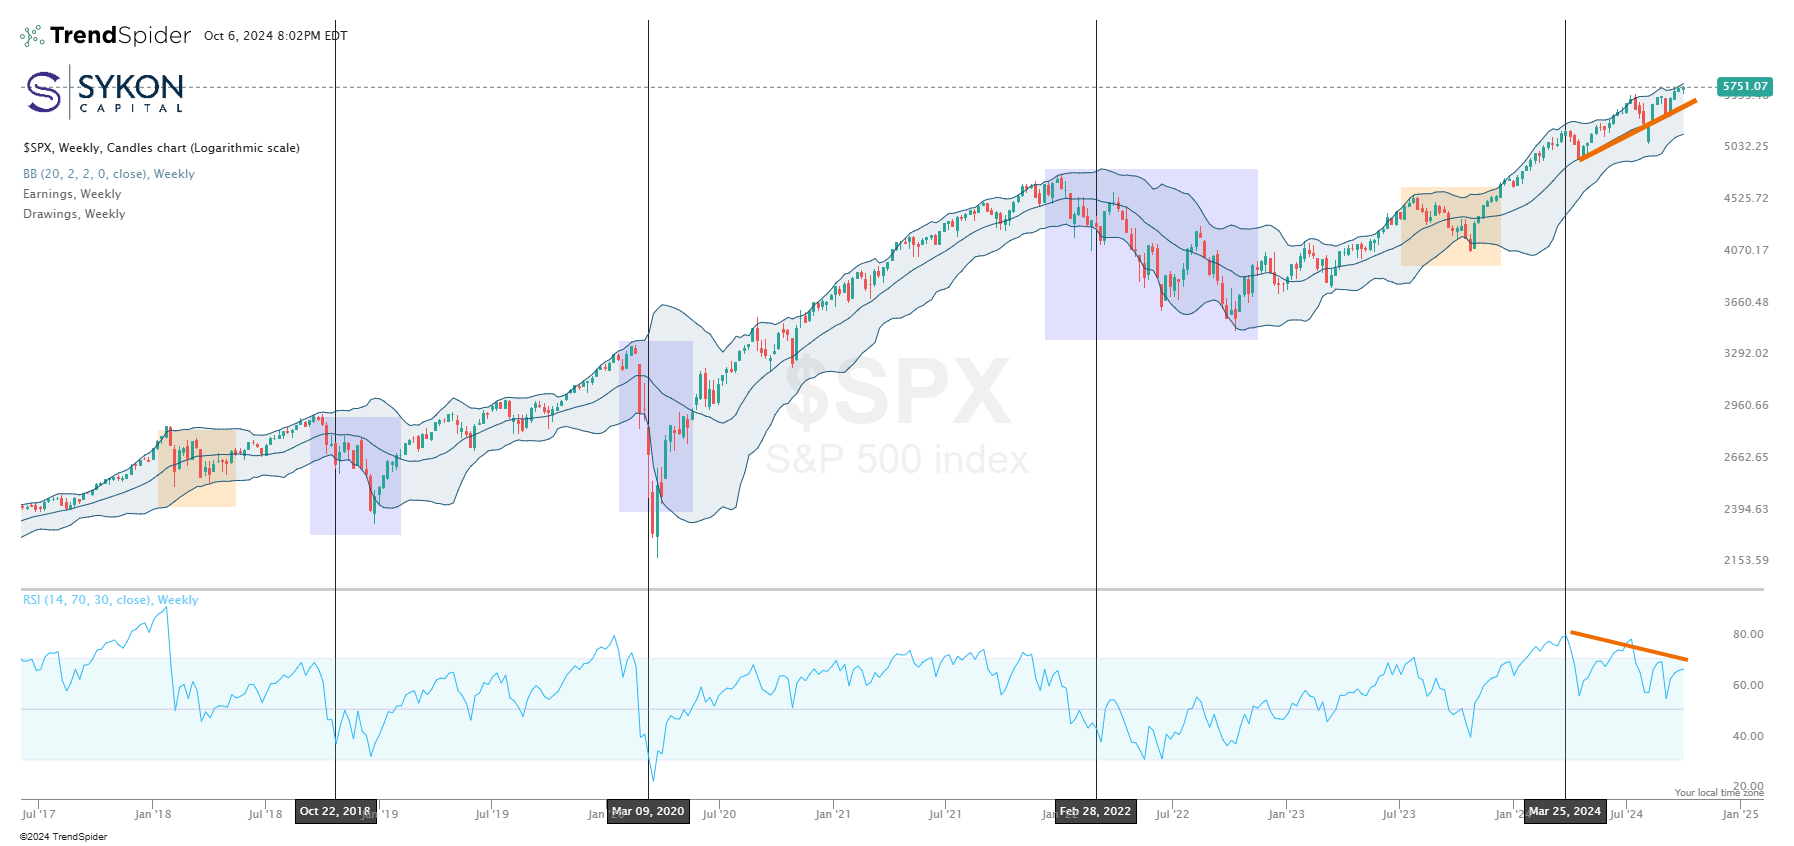
Domestically, the S&P 500 continues to hold its uptrend channel within the Bollinger Bands. In fact, it hasn’t dipped below the middle band since November 13, 2023. That’s nearly a year of climbing, but here’s the kicker: we’re starting to see bearish RSI divergences. What does that mean? While the index is making new highs, the RSI is making lower highs - a possible warning sign of a pullback.
The chart highlights two critical moments where the index bounced off the lower Bollinger Band, finding support (orange boxes). However, the purple boxes show three instances where breaking below the lower band led to a much steeper decline. Right now, the middle Bollinger Band sits around 5528.90, offering potential support, while the lower band rests near 5246.91.
No one likes talking about stops. But if you’re serious about risk management, it may be wise to set stop levels at each corresponding Bollinger Band. And if you’re considering protective puts, don’t rush into it, wait for a test of the lower band first. Otherwise, time decay (theta) could erode your option premium or it could expire worthless. Options are great, but you’ve got to know what you’re doing or consult a professional.

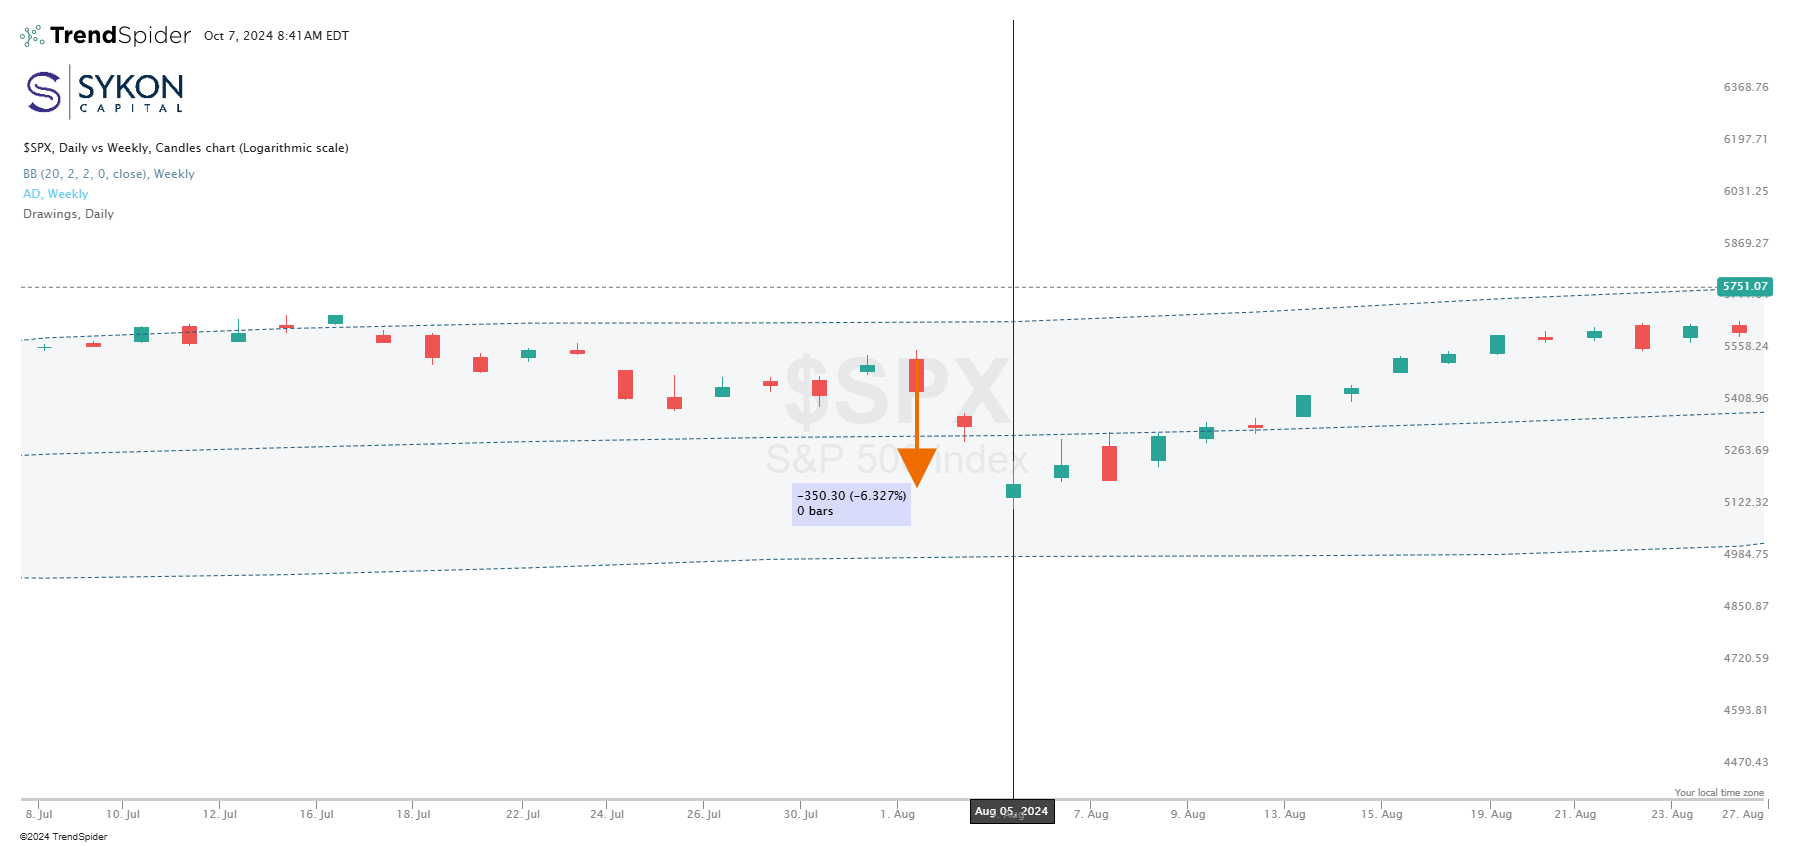
This is not an argument for having 100% of your portfolio in equities just because you’ve got stops or options in place. Risk management is not the same as risk elimination. You still need a balanced portfolio of stocks and bonds because asset allocation is your first line of defense against market shocks. Case in point: remember when the S&P 500 dropped over 6% in just three days in August? Even the best strategy couldn’t protect against that initial unforeseen shock.
Stick to the Signals
Investing doesn’t have to be complicated, but it sure isn’t simple either. There are plenty of tools and strategies out there to help us cut through the noise. The hard part is sticking to them.
- Asset Allocation First: Focus on your asset allocation and position sizing before worrying about anything else. Ask yourself, what kind of losses are you comfortable with? For example, if the FXI ETF drops 25% and you hold a 20% position, can you live with a 5% hit to your total portfolio?
- Know Your Stops: Set your stop levels based on a percentage loss or key price levels. The easy part is setting them; the hard part is sticking to them when the market gets choppy.
- Avoid Overthinking: Don’t let the news cycle or market noise throw you off. If the market is in an uptrend, stay invested. It doesn’t matter if it’s an election year, inflation is fluctuating, or the FOMC is adjusting rates - most of it is just noise.
