This Is Not a Buy and Hold "Pep Talk"
Why does it feel like no one really knows what’s going on?
Because they don’t.
You’ve seen it and so have I. Social media and the news is a nonstop loop of panic posts and hot takes from “the next Great Depression is here” to “the market is on sale.”
Funny enough, I’m not hearing “this time is different” anymore. That phrase is starting to fade.
Even though the big banks are raising their recession odds, I’m not planting a flag in either camp. I’m not forecasting anything. I don’t have to. I just pay attention to the data.
Why am I not talking about tariffs and headlines?
Because I don’t care. And you probably shouldn’t either.
The truth is, by the time you’ve digested one piece of policy news, it’s already changed again. Tariffs. Politics. Rates. All of it. Noise.
We are not building portfolios based on a headline. We are following what actually matters: price action.
What has actually changed in the market?
A lot. But what matters most is what the S&P 500 just did.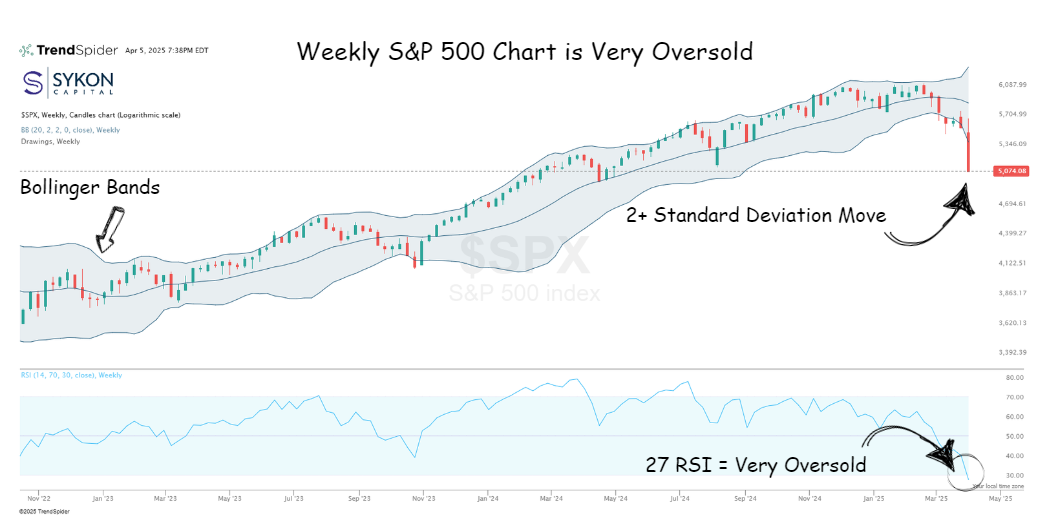
Last week’s selloff wasn’t normal. It was sharp and fast. The move was more than two standard deviations and pushed the weekly RSI down to 27.
Here’s what that means. In the past 25 years, the weekly RSI has only dropped this low seven times:
March 12, 2001 = 25.67
September 17, 2001 = 22.98
July 15, 2002 = 20.56
September 30, 2002 = 25.71
October 6, 2008 = 16.14
March 2, 2009 = 27.17
March 16, 2020 = 21.49
This doesn’t happen often. And when it does, it’s usually telling us something important.
Sometimes it marks a bottom. Other times, it is just the beginning of more downside. So which is it this time?
How can we tell if this is a correction or a bear market?
It comes down to one thing: the long-term chart of the S&P 500.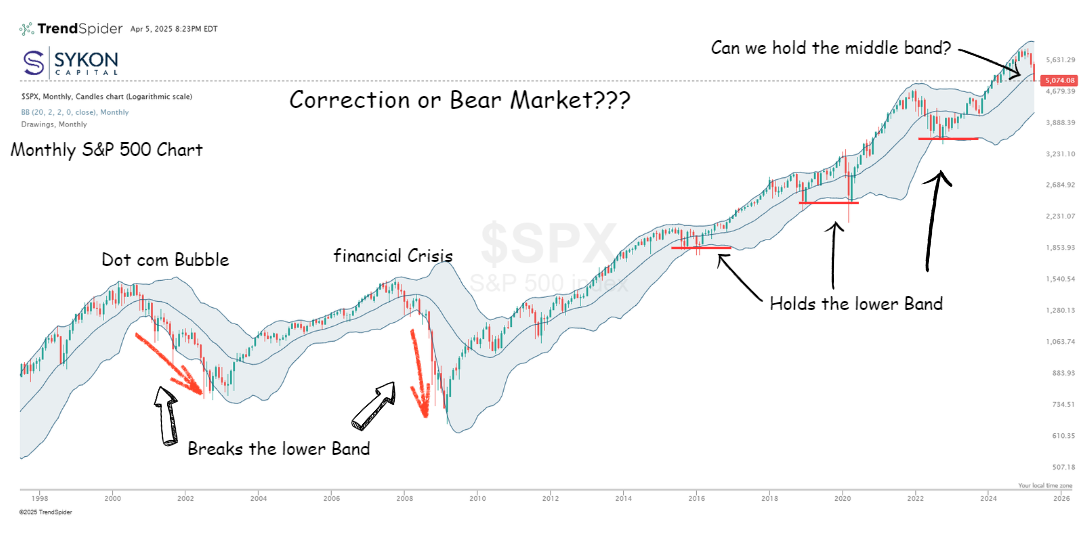
There is a big difference between a correction and a structural bear market. The key is how price behaves around the Bollinger Bands on the monthly candlestick chart.
In real bear markets, like the dot com bust or the financial crisis, the index broke the lower Bollinger Band and stayed below it on the way down.
But in normal corrections, the index bounces and resumes the trend higher.
Right now, we are sitting just above the middle Bollinger Band. That level is around 5301. If we break it on a monthly closing basis, the next target is the lower band at 4209.
We will not know until we close out April. But this is the level we are watching closely.
What are we doing about it?
We are not sitting around hoping.
This is not a “just ride it out” message. I am tired of seeing that.
Over the past two months, we have been actively reducing risk in client portfolios. And on Monday March 24, we made a significant shift. We reduced exposures and added hedges across applicable strategies into the big Monday rally, which our models indicated, and we believed, was simply an oversold bounce.
The S&P 500 index closed March 24 at 5767.
This past Friday, April 4, the index closed at 5074.
That is the value of having a real plan. This is not about guessing the bottom. It is about managing risk with intention.
So, is the market bottom in?
We do not know yet. But we are getting close to a key level.
When taking into consideration the oversold nature of the market, as indicated by the low RSI readings, the market may see another oversold bounce or, at the very least, some short-term stabilization.
If 5301 holds on a monthly basis, maybe we find support. If it breaks, 4209 is in play.
Forget the headlines. Forget the noise. Just watch the chart.
And if you’re feeling uncomfortable with the market right now, that’s okay.
There is no trophy for holding through stress you are not equipped to manage. Selling, or reducing exposure, with a plan is not weakness. It is smart. What matters most is how you do it. Random panic selling rarely ends well. But selling as part of a clear, guided plan? That is what risk management actually looks like.
So if you’re uneasy, don’t ignore it. Talk to someone. Have a plan. That’s what we’re here for.
Want to dive deeper into what we are seeing?
I am hosting a webinar:
What to Do When the Market Whipsaws
This Wednesday at 4 PM EDT
Register Here
We will go deeper into the charts, the data, and the strategy.
We will answer questions like:
- Should I buy the dip?
- Should I be in all cash?
- Does it make sense to own gold or precious metals?
- Are we already in a recession?
See you on Wednesday!
