We are about to find out if this time really is different
History doesn't repeat, but the yield curve is rhyming loud and clear. Are you prepared for what might come next?
Every economic cycle has its “this time is different” moment. It's the rallying cry of optimists, the hallmark of denial, and a phrase that history tends to make fools of. So, is it really different this time?
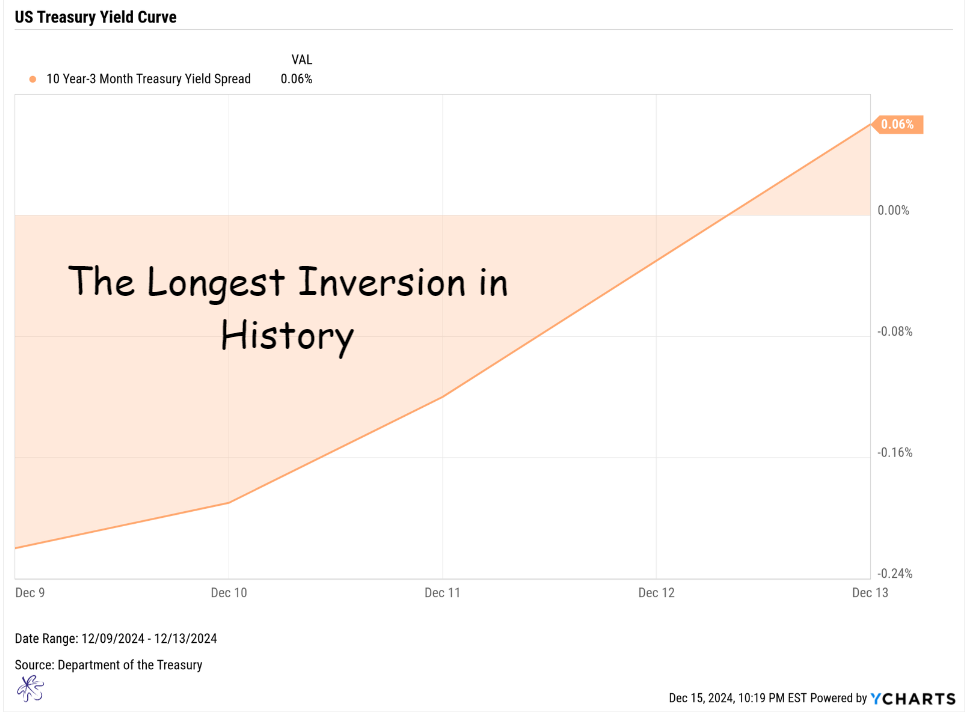
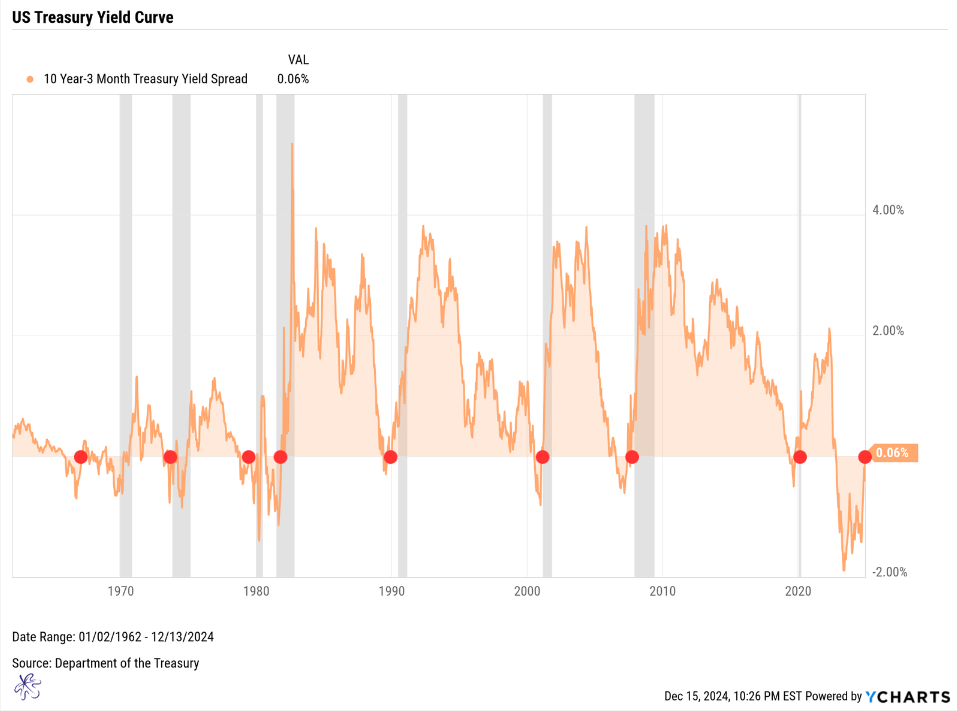
After 559 New York Stock Exchange trading sessions, the 10-year minus 3-month yield curve has reverted. This metric is a critical barometer of economic sentiment, as it measures the difference between the long-term and short-term borrowing costs of the U.S. government. An inversion, where short-term rates exceed long-term rates, often signals that investors are worried about future growth. This marks not only the longest inversion in the past 62 years but also the deepest, with the spread reaching historic levels of inversion, reflecting heightened fears of economic instability.
This yield curve reversion has preceded every single recession in the past six decades. Now we are about to find out if this time really is different.
A Reliable Indicator of Recession Risk
If you have been following me for any length of time, you will know that the yield curve is an indicator I speak about often. In my opinion, it is one of the most reliable indicators of forward-looking recession risk. Each of the red dots above indicates a point where the 10-year minus 3-month yield curve reverted after a period of inversion. Every single one of these red dots is followed by a recession.
That said, no single indicator tells the full story. Monitoring other metrics, such as equity market price trends, corporate earnings revisions, and consumer confidence indices, adds depth to our understanding of economic risks.
Timing the Recession: Historical Patterns
Now, the time it takes from reversion to recession has varied significantly, underscoring that while the yield curve is a reliable indicator, its timing can be unpredictable.
- 1967-1969: It took about two years from the time of the first reversion to the recession actually occurring in 1969.
- 1981: We were already in the midst of a recession when the yield curve reverted.
- 1989-1990: The curve reverted in August 1989, and the recession occurred in June 1990 (10 months).
- 2001: During the Dot-Com bubble burst, the curve reverted in January 2001, and the recession began in February 2001 (1 month).
- 2007-2008: With the Financial Crisis, the curve reverted in May 2007, and the recession officially began in December 2007 (7 months).
- 2019-2020: Prior to the pandemic recession, the curve reverted in October 2019, and the recession began in February 2020 (5 months).
Misinterpreting the Job Market

I can already hear the whispers: “But the job market is so strong…”
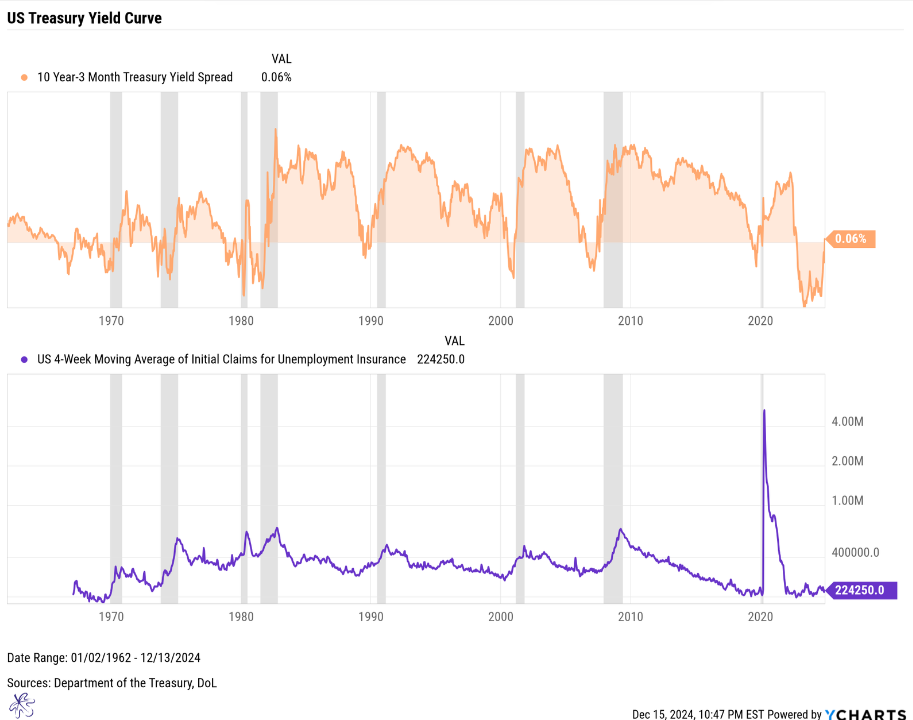
Let me let you in on a little secret. Unemployment typically lags behind other economic indicators. It does not start spiking until we have already entered the recession, which occurs after the yield curve reverts. This delay is why relying on unemployment figures to refute recession risks is fundamentally flawed. So you fundamentally can’t argue the leading indicator is wrong because the lagging indicator hasn’t yet deteriorated.

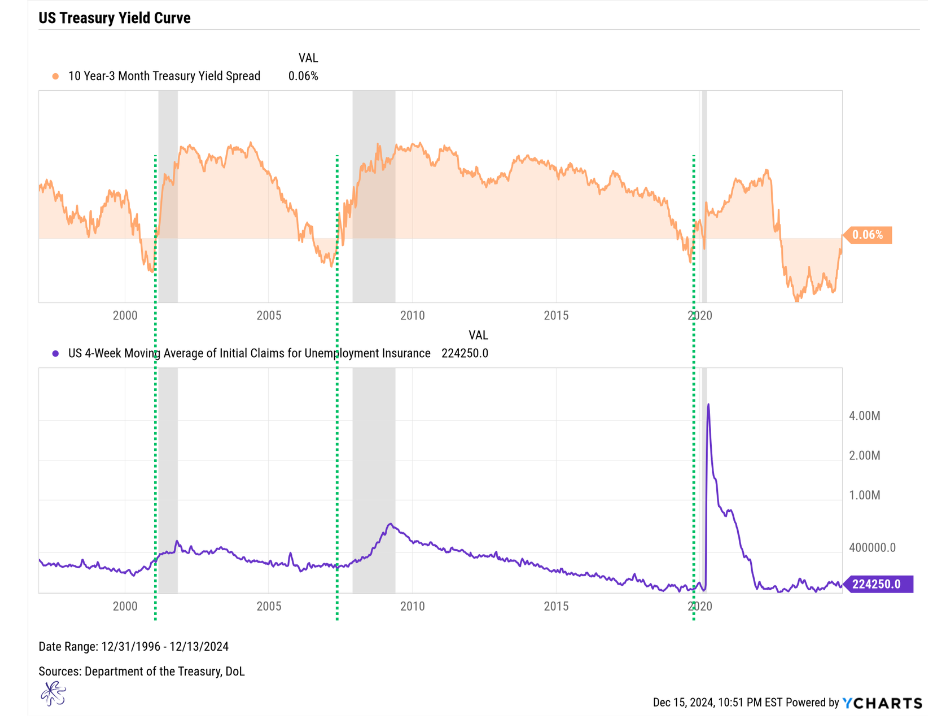
We can see that unemployment claims were actually at lows preceding the Financial Crisis and the pandemic recessions. Unemployment claims had already started to move higher when the curve reverted preceding the Dot-Com bubble recession, and notably, the time between reversion and recession was the shortest for this period.
Navigating Volatility
Now that the curve has reverted, it could well continue to be volatile, and we certainly do not expect a smooth ride. It rarely works out that way. There are multiple periods where this curve reverted and inverted multiple times before finding direction.
Beyond monitoring the 4-week moving average of initial unemployment claims, tracking trends in equity markets and credit spreads can provide early warnings of further economic weakness. If these indicators begin to signal deterioration, it’s a strong sign that history may be repeating.
Remaining Hopeful
I really hope it does not. Recessions, whether they result in a soft landing or a hard one, are deeply disruptive. They lead to job losses, financial strain, and significant emotional stress for families, turning what might seem like an abstract economic cycle into a very personal struggle for many. A recession is not just some data point on a chart.
I am neither bullish nor bearish. I simply interpret what the charts and data reveal through historical correlations and context. In this light, I have never hoped to be more wrong in my entire career.
That said, this is the time to assess your portfolio’s risk controls and ensure you have a robust risk mitigation process in place. If you’re unsure where to start, reach out. Together, we can analyze your financial plan and make sure you’re prepared for whatever the future holds.
History may not repeat exactly, but it often rhymes. The question isn’t whether we’re ready for what’s coming, it’s whether we’ve done enough to prepare.
