What does it actually mean to trade the yield curve?
Last week a client asked me about the yield curve and its importance; what exactly is the yield curve, and why does it matter so much in the world of investing? More importantly, what does it mean to trade or manage the yield curve?
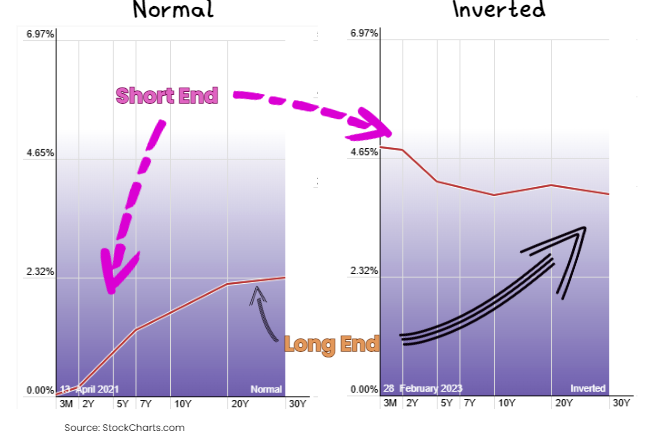
The yield curve is simply a graph that shows the interest rates of bonds with different maturities, typically U.S. Treasuries. Normally, it slopes upward, indicating that the longer the borrowing period, the higher the interest rate. The yield curve is one of the most historically reliable indicators of economic pressure and even recessions (Federal Reserve, n.d.) When the curve inverts (meaning short-term interest rates are higher than long-term rates), it often signals a recession is on the horizon.
While most people get lost in broader economic data, seasoned investors know that the bond market is often referred to as the “smart money.” We believe that this reputation stems from the bond market’s tendency to anticipate economic changes better than other asset classes.
What trading or “managing the yield curve” means
Here’s an example of a trade we just did.
A couple months ago we extended duration in short-term accounts to lock rates in at over 5% on 2 yr paper.
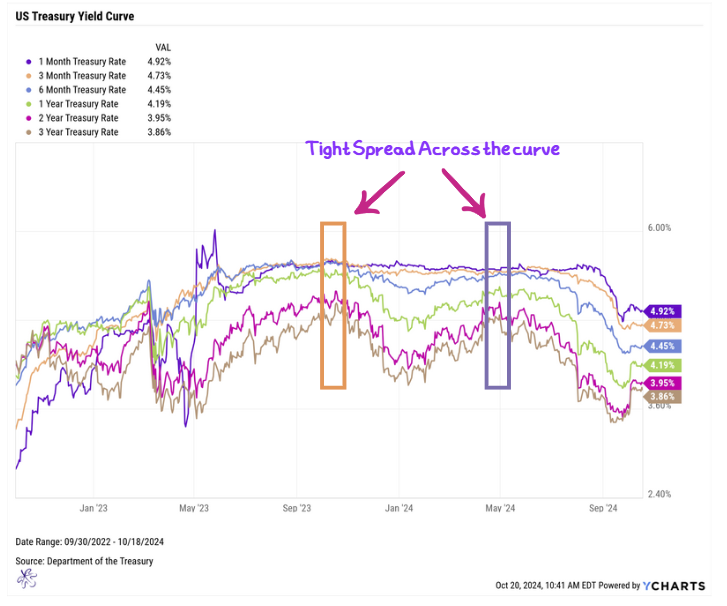
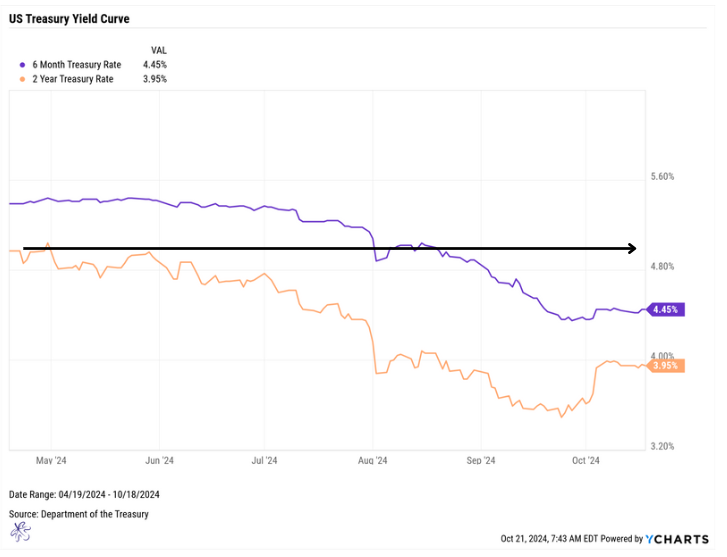
Back in April, the spread between 6-month bills and 2-year Treasuries had tightened to 42 basis points, or 0.42%, with 2-year paper trading above 5%. Given the direction of inflation, we anticipated a high probability of short-term rates decreasing over the next 6 to 9 months. Inflation had been tapering off, and we anticipated a Fed drop in interest rates in order to stimulate activity in the economy.
To help protect client yields, we reinvested maturing 6-month bills into the 2-year part of the curve, hoping to lock in a higher yield than what we believed the 6-month Treasury was going to be yielding, thus minimizing reinvestment risk.
In other words, we anticipated that the 6-month bills were going to be dropping, so we didn’t reinvest them into the same instrument when they matured. We thought 2-year rates were going to be dropping, driving up prices from current levels (price and yield move in opposite directions). So we bought the 2-year notes with the proceeds of the maturing T Bills in order to lock in the yield, because we anticipated it would be dropping.
What it does for your portfolio
For clients with short-term liquidity needs, this strategy helped maintain a higher level of cash flow for longer, compared to simply rolling over to the short end of the curve.
For example, on April 30, 2024, the 2-year Treasury was yielding 5.04%. Today, the 6-month Treasury yields 4.45%. If we had reinvested in another 6-month Treasury bill, the portfolio would be subject to significantly lower yields, potentially resulting in reduced returns and cash flow.
Imagine what would have occurred if we had waited until now, October 2024, to extend duration. After the Fed cut rates, that same 2-year Treasury is now yielding 3.95% (as opposed to 5.04%, the rate we locked in).
This example highlights the importance of managing the yield curve proactively.
Understanding the yield curve and how to manage it, we believe is key to navigating economic shifts and helps protect your portfolio from reinvestment risk. The bond market, often regarded as the “smart money,” offers invaluable signals that can help optimize returns. By proactively managing the curve, as we did with one of our recent trade, you can help secure higher yields and potentially position yourself ahead of market changes.
If you're looking to stay ahead of the curve and make informed investment decisions, subscribe to our Substack for regular insights and actionable strategies!
Sources
Federal Reserve Bank of New York, The Yield Curve as a Leading Indicator, https://www.newyorkfed.org/research/capital_markets/ycfaq.html
