What’s Next for Chinese Stocks? How to Position your Portfolio
China's $114 billion stimulus has sparked a major rally in its stock market, but is it sustainable? In this post, we break down the technical levels you need to watch and offer insights into how to position your portfolio moving forward.
China's $114 Billion Stimulus: What It Means for Investors
China’s economy is facing turbulent times, and in a bold move to steady the ship, the government just unleashed a massive $114 billion stimulus package. Investors around the world are watching closely, wondering: Is this the support the market needs, or just temporary relief?
Many are speculating that this stimulus acts as a market "put," essentially providing a safety net to prevent stock market declines. David Tepper even called this moment a "buy everything" opportunity. (Source: MSN: China's $114 Billion Stimulus Package)
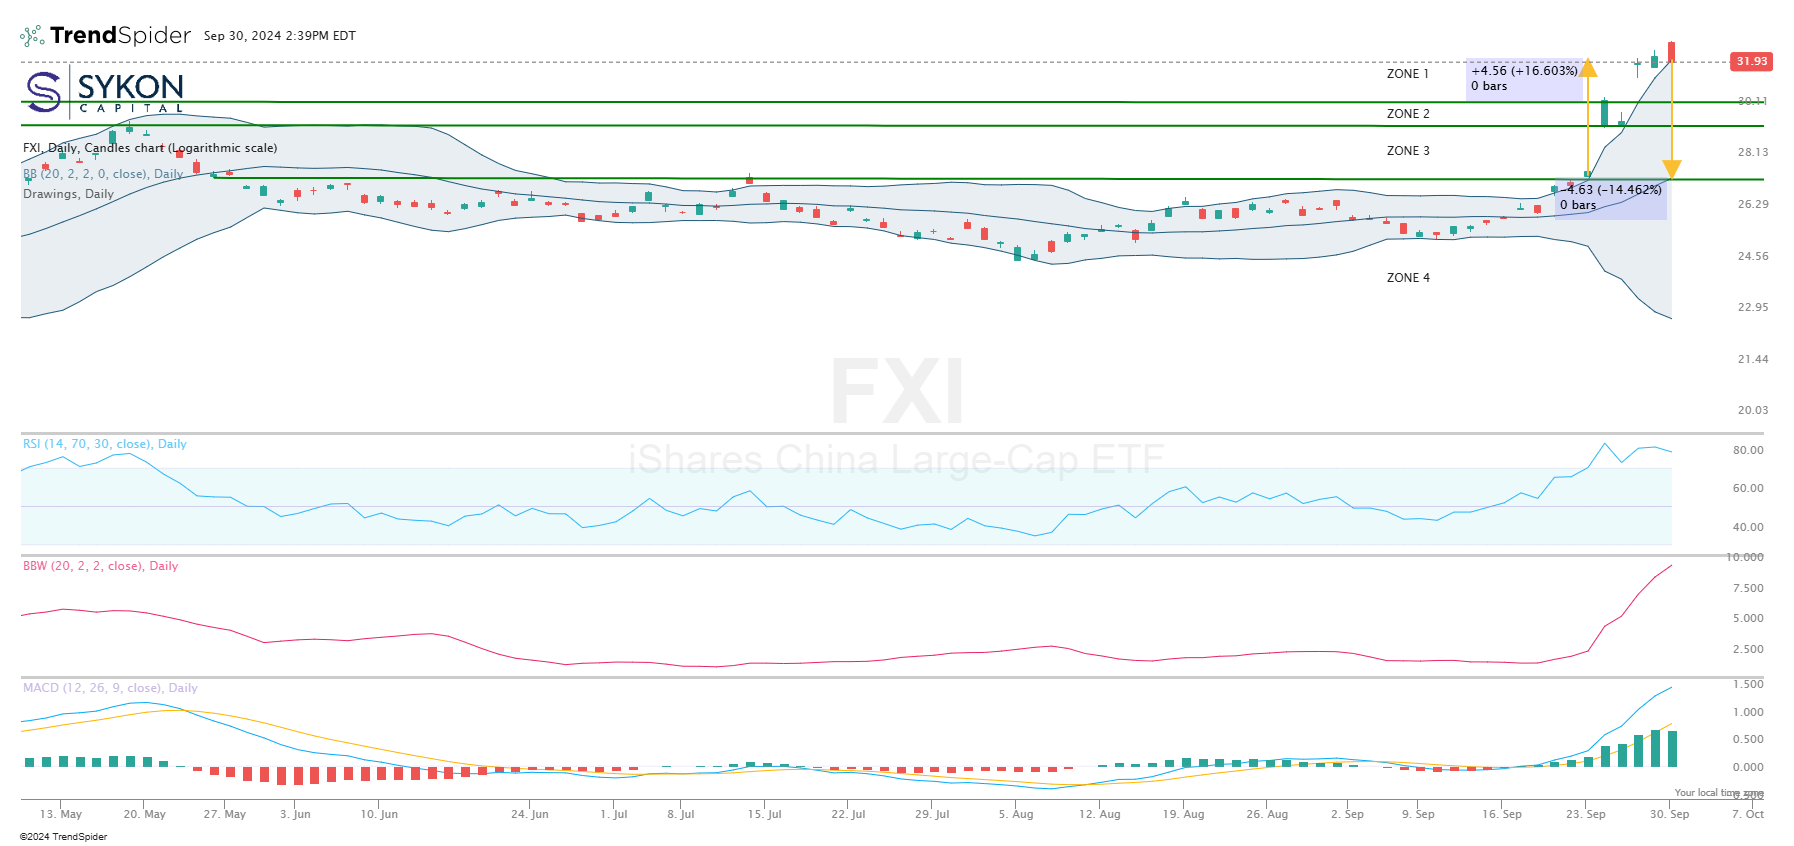
The market anticipated this stimulus package for some time. As a result, the iShares China Large Cap ETF (FXI) rallied over 16% from Monday to Friday last week. After the stimulus was officially announced, Chinese equity markets surged, closing significantly higher on Monday during Asian trading hours. However, during U.S. trading hours, FXI reversed sharply lower.
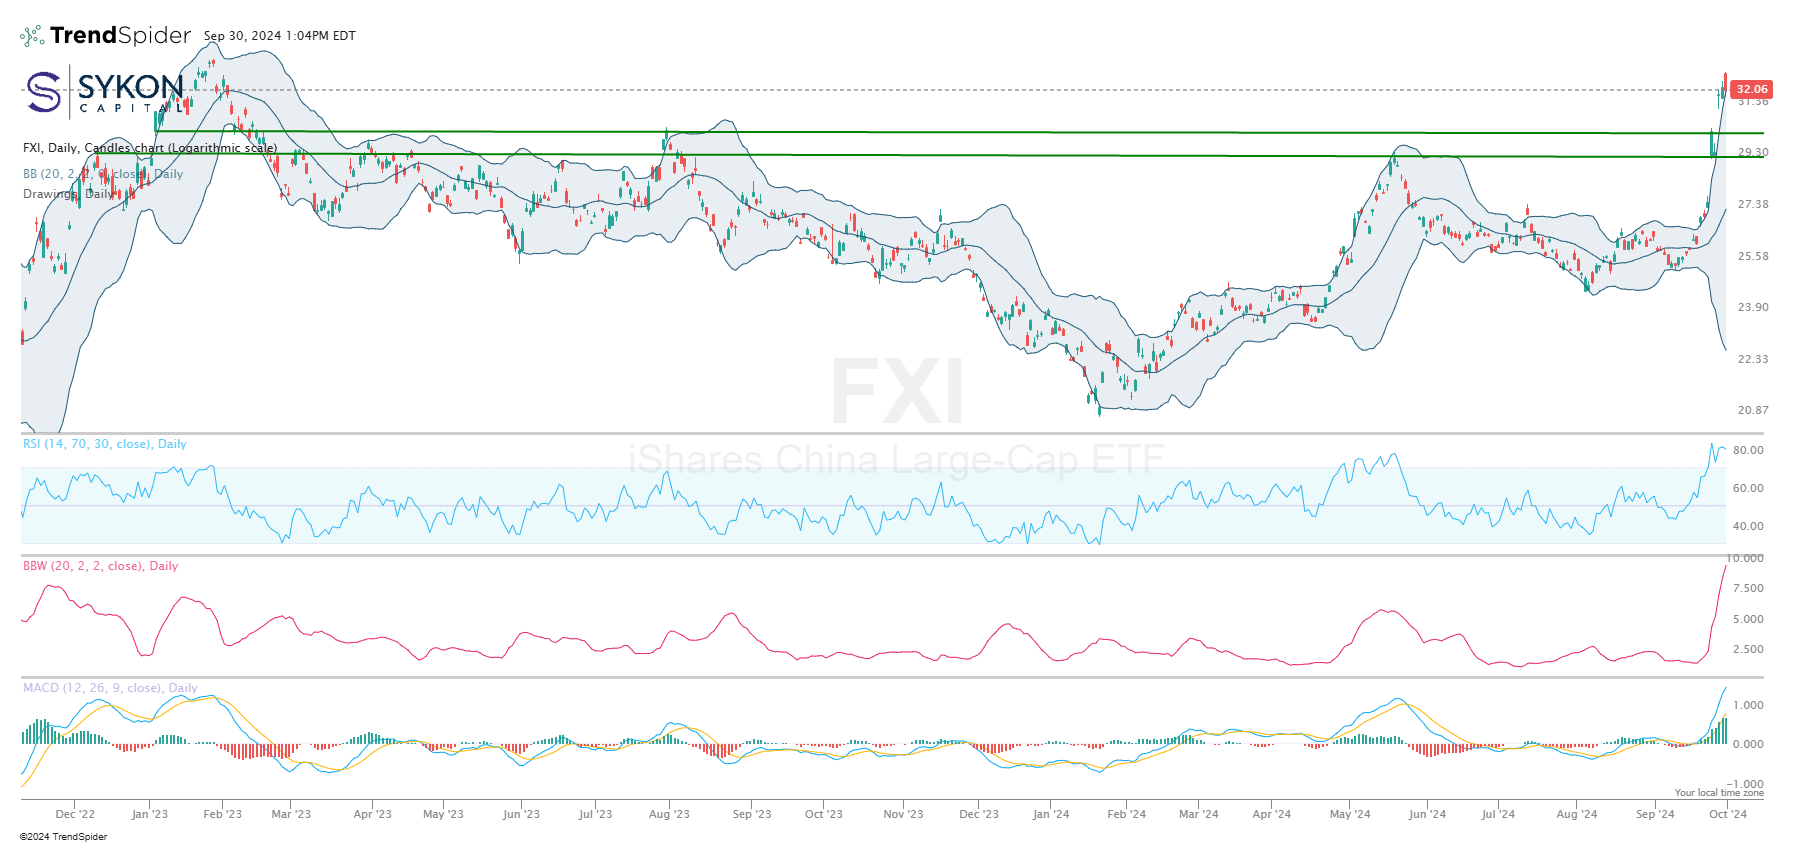
A glance at FXI’s chart reveals just how extreme this rally has been. The Relative Strength Index (RSI) closed above 80 on multiple occasions, signaling that the ETF is in extreme overbought territory.
Additionally, FXI moved outside its Upper Bollinger Band, indicating a rally beyond two standard deviations, while the Bollinger Band width expanded to its widest level since March 15, 2022 - during China’s reemergence of COVID-19.
The MACD histogram also reached its highest level since November 17, 2022, which followed a major bounce from the October 2022 lows. These extended technical indicators are rare, making this a critical moment for the ETF.
Breaking Down Key Support Zones
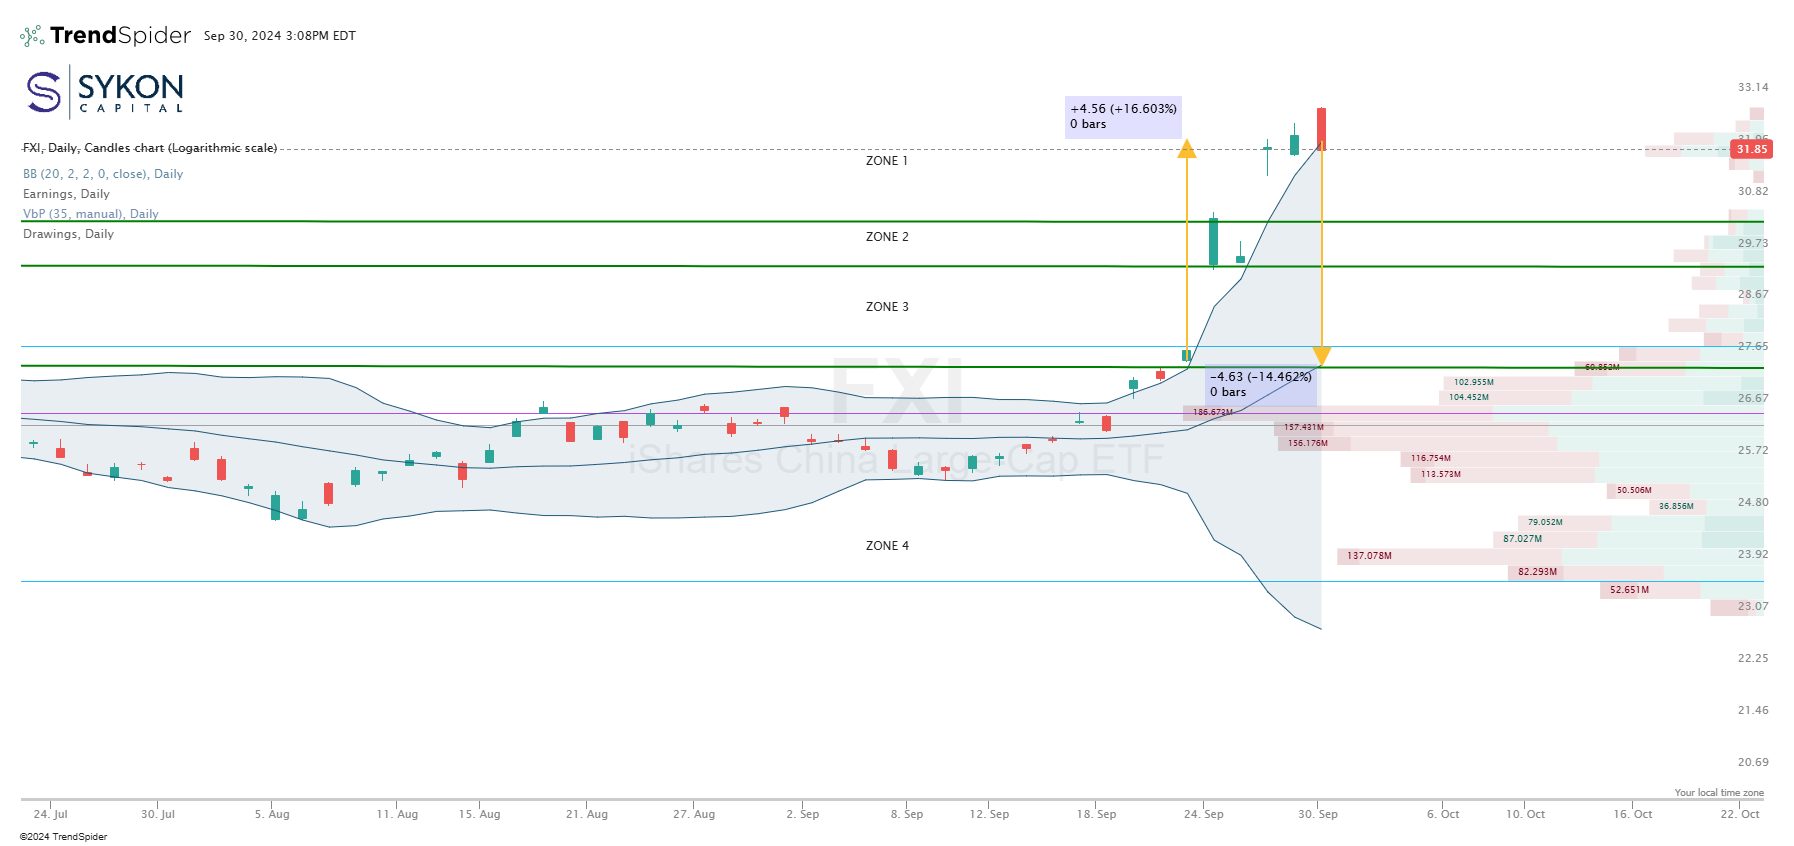
To better navigate this volatile landscape, we can divide FXI into four key support zones. Each zone represents a potential turning point where the ETF could either find support or break down further, depending on market conditions. Let’s look at each zone more closely with accompanying charts to highlight these levels:
Zone 1: If the September 27 candle low at 31.70 is broken, Zone 1 support will come into play at 30.37.
Zone 2: The next key support level is at 29.40.
Zone 3: Support is around 27.47, where price support intersects with the middle Bollinger Band.
Zone 4: Should Zone 3 break, the next significant level is 26.50, a major volume congestion area. A break here leaves an air pocket down to support at 23.92, levels last seen in Q1 of 2024.
What Should You Do with This Information?
Given these overextended technical conditions, it’s likely that FXI will at least pause at these levels. It’s hard to imagine the price continuing much higher in the near term without some sort of consolidation or pullback. Overbought conditions can resolve either through a drop in price, through time, or a combination of both. So even if FXI doesn’t drop significantly, it may simply pause and consolidate until conditions return to normal.
If you’re long from lower levels, particularly if this was a short-term trade, it might make sense to take profits or raise cash, waiting for a more favorable risk-reward setup. If you're concerned about downside risk, consider using put options to hedge lower support levels where appropriate.
For speculative traders with a high-risk tolerance, there may be opportunities to profit from using inverse ETFs that appreciate when the underlying index declines. Keep in mind that inverse ETFs are trading tools, not long-term investment vehicles. You'll want to manage your stop loss levels carefully if the trade moves against you, keep those stops tight to mitigate potential losses to a level you are comfortable with.
Beware of FOMO (Fear of Missing Out)
It’s worth considering the emotional aspect of investing, especially during volatile market moves like this. The stimulus has sparked excitement, and with gains piling up quickly, many investors may feel the pressure to jump in. This is where FOMO (Fear of Missing Out) can cloud judgment.
FOMO often leads investors to buy into rallies like this one without fully considering the risks. In this case, we see overbought signals, and a technical pullback is likely. Recognizing when FOMO is driving your decisions can help you take a step back and assess whether entering a position at these levels makes sense from a risk-reward perspective.
Patience is key, overbought markets tend to correct, either by price or time. Rushing in because "everyone else is doing it" can result in buying at the top. A disciplined approach, such as waiting for a pullback or consolidation can often yield better results.
Navigating a Stimulus-Fueled Rally
China’s massive stimulus has sparked a rally, but overbought conditions suggest caution is warranted. Whether you’re taking profits, hedging with options, or speculating with inverse ETFs, this is a volatile environment with significant risks ahead.
It’s almost like China threw a financial lifeline, and now the market is holding its breath, wondering if it’s enough, or if the water is still too deep.
If you would like to receive these insights straight to your inbox every Tuesday and Thursday, be sure to subscribe to Market Mindset - Technicals with a Twist here
